
 Yahoo Finance
 Is ING Groep NV (AMS:INGA) Attractive At This PE Ratio?

The content of this article will benefit those of you who are starting to educate yourself about investing in the stock market and want to learn about the link between company’s fundamentals and stock market performance.
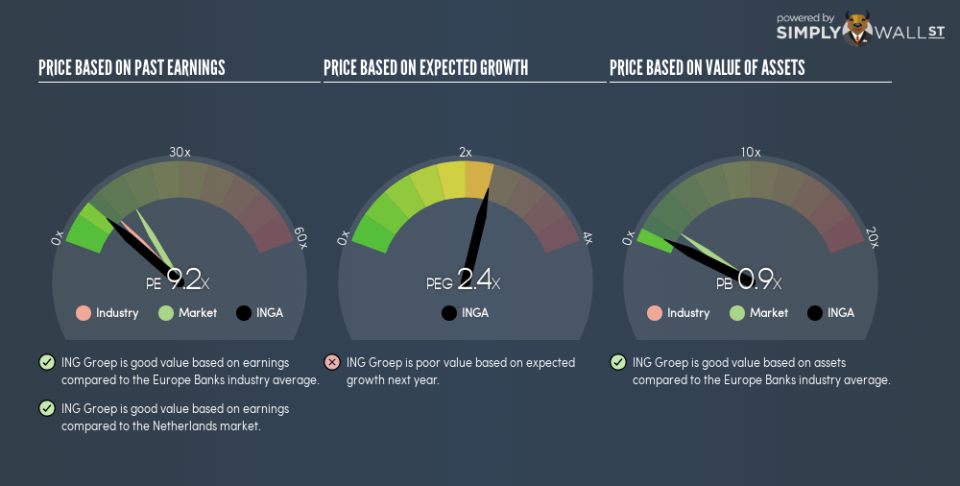
ING Groep NV (AMS:INGA) is trading with a trailing P/E of 9.2x, which is lower than the industry average of 11.4x. While INGA might seem like an attractive stock to buy, it is important to understand the assumptions behind the P/E ratio before you make any investment decisions. Today, I will break down what the P/E ratio is, how to interpret it and what to watch out for.
Check out our latest analysis for ING Groep
Breaking down the Price-Earnings ratio
A common ratio used for relative valuation is the P/E ratio. By comparing a stock’s price per share to its earnings per share, we are able to see how much investors are paying for each dollar of the company’s earnings.
P/E Calculation for INGA
Price-Earnings Ratio = Price per share ÷ Earnings per share
INGA Price-Earnings Ratio = €11.91 ÷ €1.298 = 9.2x
On its own, the P/E ratio doesn’t tell you much; however, it becomes extremely useful when you compare it with other similar companies. Our goal is to compare the stock’s P/E ratio to the average of companies that have similar attributes to INGA, such as company lifetime and products sold. A quick method of creating a peer group is to use companies in the same industry, which is what I will do. Since INGA’s P/E of 9.2x is lower than its industry peers (14.6x), it means that investors are paying less than they should for each dollar of INGA’s earnings. Since the Banks sector in NL is relatively small, I’ve included similar companies in the wider region in order to get a better idea of the multiple, which is a median of profitable companies of companies such as NIBC Holding, ABN AMRO Group and Van Lanschot Kempen. As such, our analysis shows that INGA represents an under-priced stock.
A few caveats
While our conclusion might prompt you to buy INGA immediately, there are two important assumptions you should be aware of. Firstly, our peer group contains companies that are similar to INGA. If this isn’t the case, the difference in P/E could be due to other factors. For example, if you compared higher growth firms with INGA, then its P/E would naturally be lower since investors would reward its peers’ higher growth with a higher price. The second assumption that must hold true is that the stocks we are comparing INGA to are fairly valued by the market. If this does not hold true, INGA’s lower P/E ratio may be because firms in our peer group are overvalued by the market.
What this means for you:
If your personal research into the stock confirms what the P/E ratio is telling you, it might be a good time to add more of INGA to your portfolio. But keep in mind that the usefulness of relative valuation depends on whether you are comfortable with making the assumptions I mentioned above. Remember that basing your investment decision off one metric alone is certainly not sufficient. There are many things I have not taken into account in this article and the PE ratio is very one-dimensional. If you have not done so already, I highly recommend you to complete your research by taking a look at the following:
Future Outlook: What are well-informed industry analysts predicting for INGA’s future growth? Take a look at our free research report of analyst consensus for INGA’s outlook.
Past Track Record: Has INGA been consistently performing well irrespective of the ups and downs in the market? Go into more detail in the past performance analysis and take a look at the free visual representations of INGA’s historicals for more clarity.
Other High-Performing Stocks: Are there other stocks that provide better prospects with proven track records? Explore our free list of these great stocks here.
To help readers see past the short term volatility of the financial market, we aim to bring you a long-term focused research analysis purely driven by fundamental data. Note that our analysis does not factor in the latest price-sensitive company announcements.
The author is an independent contributor and at the time of publication had no position in the stocks mentioned. For errors that warrant correction please contact the editor at editorial-team@simplywallst.com.
