
 Yahoo Finance
 Inca Minerals (ASX:ICG) Is Looking To Continue Growing Its Returns On Capital
If you're looking for a multi-bagger, there's a few things to keep an eye out for. One common approach is to try and find a company with returns on capital employed (ROCE) that are increasing, in conjunction with a growing amount of capital employed. Basically this means that a company has profitable initiatives that it can continue to reinvest in, which is a trait of a compounding machine. So when we looked at Inca Minerals (ASX:ICG) and its trend of ROCE, we really liked what we saw.
Return On Capital Employed (ROCE): What is it?
If you haven't worked with ROCE before, it measures the 'return' (pre-tax profit) a company generates from capital employed in its business. The formula for this calculation on Inca Minerals is:
Return on Capital Employed = Earnings Before Interest and Tax (EBIT) ÷ (Total Assets - Current Liabilities)
0.094 = AU$1.8m ÷ (AU$20m - AU$767k) (Based on the trailing twelve months to June 2021).
Therefore, Inca Minerals has an ROCE of 9.4%. On its own that's a low return on capital but it's in line with the industry's average returns of 9.4%.
View our latest analysis for Inca Minerals
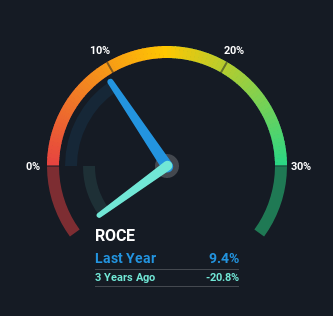
Historical performance is a great place to start when researching a stock so above you can see the gauge for Inca Minerals' ROCE against it's prior returns. If you want to delve into the historical earnings, revenue and cash flow of Inca Minerals, check out these free graphs here.
What The Trend Of ROCE Can Tell Us
The fact that Inca Minerals is now generating some pre-tax profits from its prior investments is very encouraging. About five years ago the company was generating losses but things have turned around because it's now earning 9.4% on its capital. And unsurprisingly, like most companies trying to break into the black, Inca Minerals is utilizing 3,599% more capital than it was five years ago. This can tell us that the company has plenty of reinvestment opportunities that are able to generate higher returns.
One more thing to note, Inca Minerals has decreased current liabilities to 3.8% of total assets over this period, which effectively reduces the amount of funding from suppliers or short-term creditors. So shareholders would be pleased that the growth in returns has mostly come from underlying business performance.
Our Take On Inca Minerals' ROCE
Overall, Inca Minerals gets a big tick from us thanks in most part to the fact that it is now profitable and is reinvesting in its business. Given the stock has declined 58% in the last five years, this could be a good investment if the valuation and other metrics are also appealing. So researching this company further and determining whether or not these trends will continue seems justified.
If you want to know some of the risks facing Inca Minerals we've found 5 warning signs (1 doesn't sit too well with us!) that you should be aware of before investing here.
While Inca Minerals may not currently earn the highest returns, we've compiled a list of companies that currently earn more than 25% return on equity. Check out this free list here.
Have feedback on this article? Concerned about the content? Get in touch with us directly. Alternatively, email editorial-team (at) simplywallst.com.
This article by Simply Wall St is general in nature. We provide commentary based on historical data and analyst forecasts only using an unbiased methodology and our articles are not intended to be financial advice. It does not constitute a recommendation to buy or sell any stock, and does not take account of your objectives, or your financial situation. We aim to bring you long-term focused analysis driven by fundamental data. Note that our analysis may not factor in the latest price-sensitive company announcements or qualitative material. Simply Wall St has no position in any stocks mentioned.
