
 Yahoo Finance
 Is IMV Inc.'s (TSE:IMV) CEO Paid Enough Relative To Peers?

Fred Ors became the CEO of IMV Inc. (TSE:IMV) in 2016. This analysis aims first to contrast CEO compensation with other companies that have similar market capitalization. Then we'll look at a snap shot of the business growth. Third, we'll reflect on the total return to shareholders over three years, as a second measure of business performance. This method should give us information to assess how appropriately the company pays the CEO.
View our latest analysis for IMV
How Does Fred Ors's Compensation Compare With Similar Sized Companies?
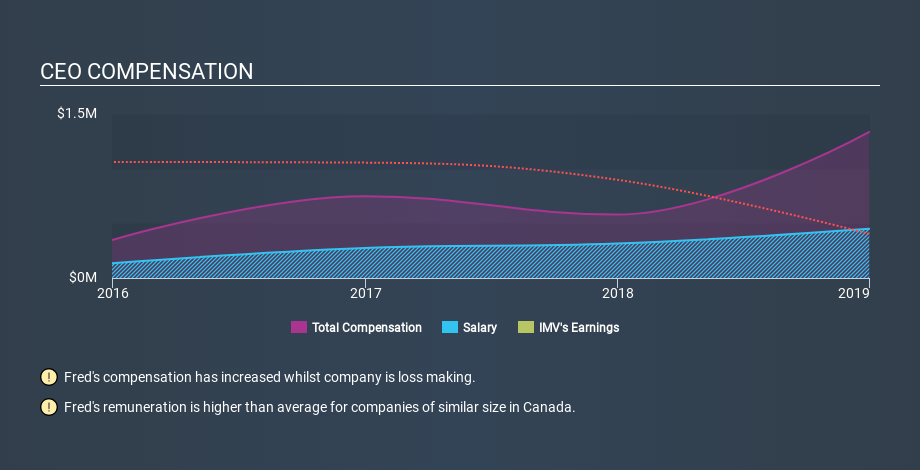
At the time of writing, our data says that IMV Inc. has a market cap of CA$305m, and reported total annual CEO compensation of CA$1.3m for the year to December 2018. We think total compensation is more important but we note that the CEO salary is lower, at CA$450k. We note that more than half of the total compensation is not the salary; and performance requirements may apply to this non-salary portion. As part of our analysis we looked at companies in the same jurisdiction, with market capitalizations of CA$132m to CA$529m. The median total CEO compensation was CA$901k.
As you can see, Fred Ors is paid more than the median CEO pay at companies of a similar size, in the same market. However, this does not necessarily mean IMV Inc. is paying too much. We can get a better idea of how generous the pay is by looking at the performance of the underlying business.
The graphic below shows how CEO compensation at IMV has changed from year to year.
Is IMV Inc. Growing?
Over the last three years IMV Inc. has shrunk its earnings per share by an average of 29% per year (measured with a line of best fit). In the last year, its revenue is down 28%.
Unfortunately, earnings per share have trended lower over the last three years. And the impression is worse when you consider revenue is down year-on-year. These factors suggest that the business performance wouldn't really justify a high pay packet for the CEO. You might want to check this free visual report on analyst forecasts for future earnings.
Has IMV Inc. Been A Good Investment?
I think that the total shareholder return of 76%, over three years, would leave most IMV Inc. shareholders smiling. So they may not be at all concerned if the CEO were to be paid more than is normal for companies around the same size.
In Summary...
We compared total CEO remuneration at IMV Inc. with the amount paid at companies with a similar market capitalization. Our data suggests that it pays above the median CEO pay within that group.
Neither earnings per share nor revenue have been growing sufficiently to impress us, over the last three years. On the other hand, returns have been good, so the company is doing something right. Given this situation we doubt shareholders are particularly concerned about the CEO compensation. So you may want to check if insiders are buying IMV shares with their own money (free access).
Important note: IMV may not be the best stock to buy. You might find something better in this list of interesting companies with high ROE and low debt.
If you spot an error that warrants correction, please contact the editor at editorial-team@simplywallst.com. This article by Simply Wall St is general in nature. It does not constitute a recommendation to buy or sell any stock, and does not take account of your objectives, or your financial situation. Simply Wall St has no position in the stocks mentioned.
We aim to bring you long-term focused research analysis driven by fundamental data. Note that our analysis may not factor in the latest price-sensitive company announcements or qualitative material. Thank you for reading.
