
 Yahoo Finance
 IMI (LON:IMI) Is Increasing Its Dividend To £0.083
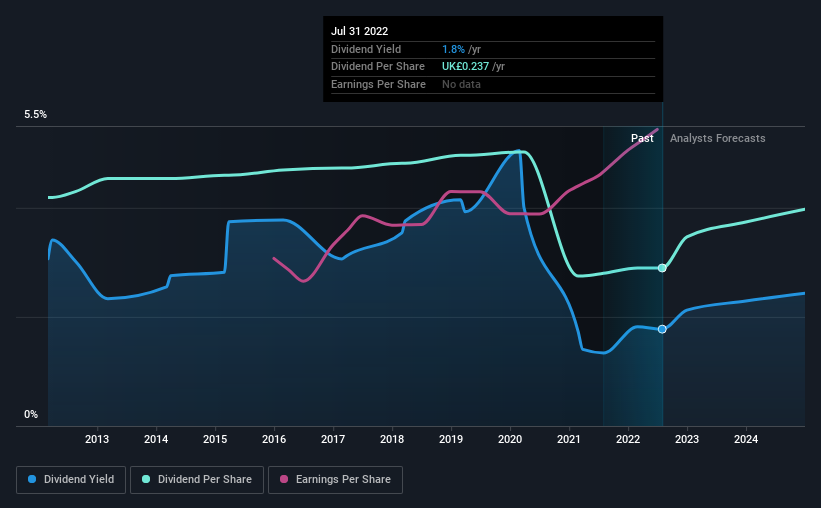
IMI plc (LON:IMI) will increase its dividend on the 16th of September to £0.083, which is 5.1% higher than last year's payment from the same period of £0.079. This makes the dividend yield about the same as the industry average at 1.8%.
Check out our latest analysis for IMI
IMI's Payment Has Solid Earnings Coverage
While it is always good to see a solid dividend yield, we should also consider whether the payment is feasible. However, prior to this announcement, IMI's dividend was comfortably covered by both cash flow and earnings. As a result, a large proportion of what it earned was being reinvested back into the business.
Looking forward, earnings per share is forecast to rise by 34.8% over the next year. Assuming the dividend continues along recent trends, we think the payout ratio could be 21% by next year, which is in a pretty sustainable range.
Dividend Volatility
The company has a long dividend track record, but it doesn't look great with cuts in the past. The annual payment during the last 10 years was £0.343 in 2012, and the most recent fiscal year payment was £0.237. Doing the maths, this is a decline of about 3.6% per year. A company that decreases its dividend over time generally isn't what we are looking for.
The Dividend Has Growth Potential
With a relatively unstable dividend, it's even more important to evaluate if earnings per share is growing, which could point to a growing dividend in the future. IMI has seen EPS rising for the last five years, at 7.3% per annum. With a decent amount of growth and a low payout ratio, we think this bodes well for IMI's prospects of growing its dividend payments in the future.
In Summary
Overall, this is a reasonable dividend, and it being raised is an added bonus. While the payout ratios are a good sign, we are less enthusiastic about the company's dividend record. Taking all of this into consideration, the dividend looks viable moving forward, but investors should be mindful that the company has pushed the boundaries of sustainability in the past and may do so again.
Companies possessing a stable dividend policy will likely enjoy greater investor interest than those suffering from a more inconsistent approach. Meanwhile, despite the importance of dividend payments, they are not the only factors our readers should know when assessing a company. Taking the debate a bit further, we've identified 1 warning sign for IMI that investors need to be conscious of moving forward. Is IMI not quite the opportunity you were looking for? Why not check out our selection of top dividend stocks.
Have feedback on this article? Concerned about the content? Get in touch with us directly. Alternatively, email editorial-team (at) simplywallst.com.
This article by Simply Wall St is general in nature. We provide commentary based on historical data and analyst forecasts only using an unbiased methodology and our articles are not intended to be financial advice. It does not constitute a recommendation to buy or sell any stock, and does not take account of your objectives, or your financial situation. We aim to bring you long-term focused analysis driven by fundamental data. Note that our analysis may not factor in the latest price-sensitive company announcements or qualitative material. Simply Wall St has no position in any stocks mentioned.
Join A Paid User Research Session
You’ll receive a US$30 Amazon Gift card for 1 hour of your time while helping us build better investing tools for the individual investors like yourself. Sign up here
