
 Yahoo Finance
 Can You Imagine How Royal Dutch Shell's (AMS:RDSA) Shareholders Feel About The 20% Share Price Increase?
Investors can buy low cost index fund if they want to receive the average market return. But in any diversified portfolio of stocks, you'll see some that fall short of the average. Unfortunately for shareholders, while the Royal Dutch Shell plc (AMS:RDSA) share price is up 20% in the last three years, that falls short of the market return. Zooming in, the stock is actually down 1.7% in the last year.
Check out our latest analysis for Royal Dutch Shell
To paraphrase Benjamin Graham: Over the short term the market is a voting machine, but over the long term it's a weighing machine. One flawed but reasonable way to assess how sentiment around a company has changed is to compare the earnings per share (EPS) with the share price.
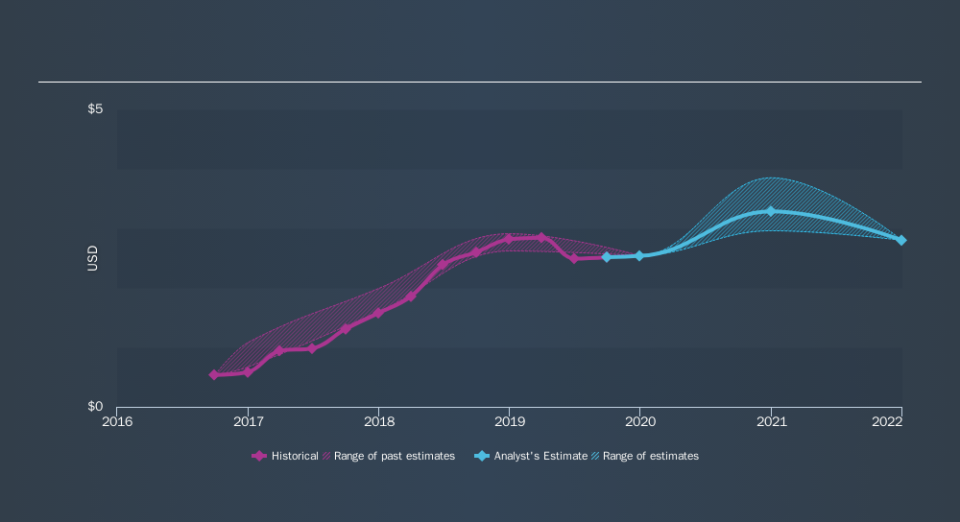
Royal Dutch Shell was able to grow its EPS at 67% per year over three years, sending the share price higher. The average annual share price increase of 6.3% is actually lower than the EPS growth. So it seems investors have become more cautious about the company, over time. This cautious sentiment is reflected in its (fairly low) P/E ratio of 11.91.
You can see how EPS has changed over time in the image below (click on the chart to see the exact values).
It's probably worth noting we've seen significant insider buying in the last quarter, which we consider a positive. On the other hand, we think the revenue and earnings trends are much more meaningful measures of the business. It might be well worthwhile taking a look at our free report on Royal Dutch Shell's earnings, revenue and cash flow.
What About Dividends?
When looking at investment returns, it is important to consider the difference between total shareholder return (TSR) and share price return. Whereas the share price return only reflects the change in the share price, the TSR includes the value of dividends (assuming they were reinvested) and the benefit of any discounted capital raising or spin-off. It's fair to say that the TSR gives a more complete picture for stocks that pay a dividend. We note that for Royal Dutch Shell the TSR over the last 3 years was 42%, which is better than the share price return mentioned above. And there's no prize for guessing that the dividend payments largely explain the divergence!
A Different Perspective
Royal Dutch Shell shareholders are up 4.6% for the year (even including dividends) . But that return falls short of the market. It's probably a good sign that the company has an even better long term track record, having provided shareholders with an annual TSR of 6.1% over five years. It's quite possible the business continues to execute with prowess, even as the share price gains are slowing. It is all well and good that insiders have been buying shares, but we suggest you check here to see what price insiders were buying at.
Royal Dutch Shell is not the only stock insiders are buying. So take a peek at this free list of growing companies with insider buying.
Please note, the market returns quoted in this article reflect the market weighted average returns of stocks that currently trade on NL exchanges.
We aim to bring you long-term focused research analysis driven by fundamental data. Note that our analysis may not factor in the latest price-sensitive company announcements or qualitative material.
If you spot an error that warrants correction, please contact the editor at editorial-team@simplywallst.com. This article by Simply Wall St is general in nature. It does not constitute a recommendation to buy or sell any stock, and does not take account of your objectives, or your financial situation. Simply Wall St has no position in the stocks mentioned. Thank you for reading.