
 Yahoo Finance
 Imagine Owning Redwood Trust (NYSE:RWT) And Trying To Stomach The 83% Share Price Drop

We're definitely into long term investing, but some companies are simply bad investments over any time frame. It hits us in the gut when we see fellow investors suffer a loss. For example, we sympathize with anyone who was caught holding Redwood Trust, Inc. (NYSE:RWT) during the five years that saw its share price drop a whopping 83%. We also note that the stock has performed poorly over the last year, with the share price down 81%. The falls have accelerated recently, with the share price down 82% in the last three months.
We really feel for shareholders in this scenario. It's a good reminder of the importance of diversification, and it's worth keeping in mind there's more to life than money, anyway.
Check out our latest analysis for Redwood Trust
While markets are a powerful pricing mechanism, share prices reflect investor sentiment, not just underlying business performance. One flawed but reasonable way to assess how sentiment around a company has changed is to compare the earnings per share (EPS) with the share price.
During the unfortunate half decade during which the share price slipped, Redwood Trust actually saw its earnings per share (EPS) improve by 6.6% per year. Given the share price reaction, one might suspect that EPS is not a good guide to the business performance during the period (perhaps due to a one-off loss or gain). Alternatively, growth expectations may have been unreasonable in the past.
Because of the sharp contrast between the EPS growth rate and the share price growth, we're inclined to look to other metrics to understand the changing market sentiment around the stock.
The steady dividend doesn't really explain why the share price is down. While it's not completely obvious why the share price is down, a closer look at the company's history might help explain it.
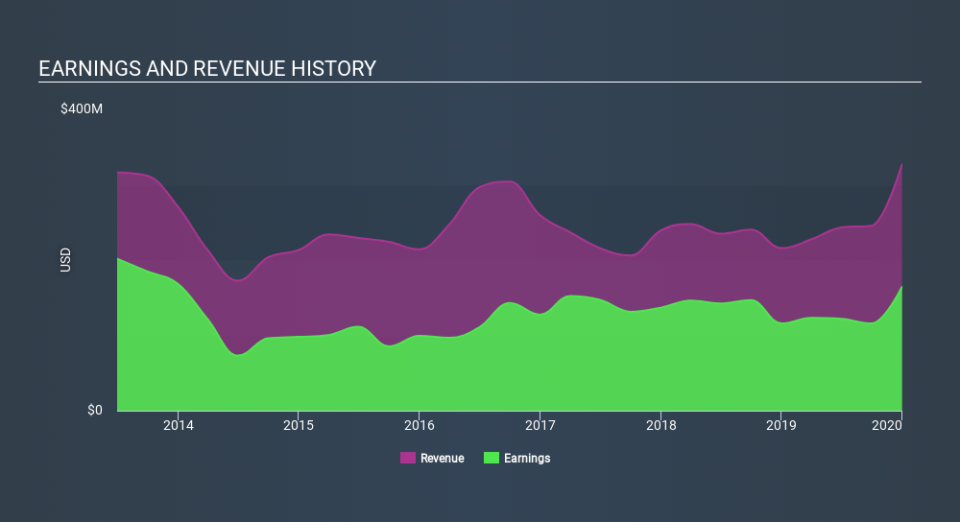
The graphic below depicts how earnings and revenue have changed over time (unveil the exact values by clicking on the image).
We know that Redwood Trust has improved its bottom line lately, but what does the future have in store? So it makes a lot of sense to check out what analysts think Redwood Trust will earn in the future (free profit forecasts).
What About Dividends?
As well as measuring the share price return, investors should also consider the total shareholder return (TSR). The TSR incorporates the value of any spin-offs or discounted capital raisings, along with any dividends, based on the assumption that the dividends are reinvested. Arguably, the TSR gives a more comprehensive picture of the return generated by a stock. As it happens, Redwood Trust's TSR for the last 5 years was -76%, which exceeds the share price return mentioned earlier. And there's no prize for guessing that the dividend payments largely explain the divergence!
A Different Perspective
We regret to report that Redwood Trust shareholders are down 79% for the year (even including dividends) . Unfortunately, that's worse than the broader market decline of 8.1%. Having said that, it's inevitable that some stocks will be oversold in a falling market. The key is to keep your eyes on the fundamental developments. Unfortunately, last year's performance may indicate unresolved challenges, given that it was worse than the annualised loss of 25% over the last half decade. Generally speaking long term share price weakness can be a bad sign, though contrarian investors might want to research the stock in hope of a turnaround. It's always interesting to track share price performance over the longer term. But to understand Redwood Trust better, we need to consider many other factors. To that end, you should learn about the 3 warning signs we've spotted with Redwood Trust (including 1 which is is potentially serious) .
Of course Redwood Trust may not be the best stock to buy. So you may wish to see this free collection of growth stocks.
Please note, the market returns quoted in this article reflect the market weighted average returns of stocks that currently trade on US exchanges.
If you spot an error that warrants correction, please contact the editor at editorial-team@simplywallst.com. This article by Simply Wall St is general in nature. It does not constitute a recommendation to buy or sell any stock, and does not take account of your objectives, or your financial situation. Simply Wall St has no position in the stocks mentioned.
We aim to bring you long-term focused research analysis driven by fundamental data. Note that our analysis may not factor in the latest price-sensitive company announcements or qualitative material. Thank you for reading.
