
 Yahoo Finance
 Can You Imagine How Jubilant Kraken Robotics' (CVE:PNG) Shareholders Feel About Its 141% Share Price Gain?
The last three months have been tough on Kraken Robotics Inc. (CVE:PNG) shareholders, who have seen the share price decline a rather worrying 32%. But that doesn't change the fact that the returns over the last five years have been very strong. In fact, the share price is 141% higher today. We think it's more important to dwell on the long term returns than the short term returns. Of course, that doesn't necessarily mean it's cheap now. While the long term returns are impressive, we do have some sympathy for those who bought more recently, given the 47% drop, in the last year.
See our latest analysis for Kraken Robotics
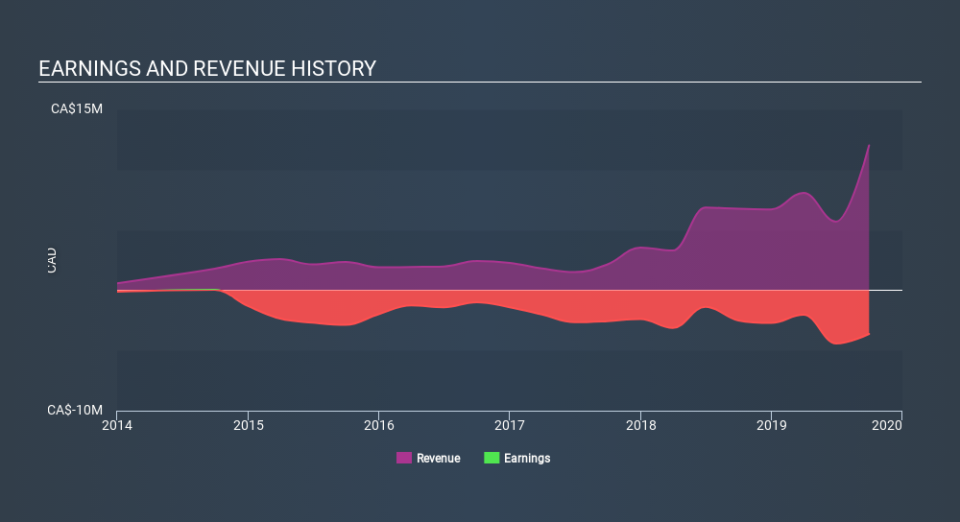
Given that Kraken Robotics didn't make a profit in the last twelve months, we'll focus on revenue growth to form a quick view of its business development. When a company doesn't make profits, we'd generally expect to see good revenue growth. That's because it's hard to be confident a company will be sustainable if revenue growth is negligible, and it never makes a profit.
In the last 5 years Kraken Robotics saw its revenue grow at 37% per year. That's well above most pre-profit companies. Meanwhile, its share price performance certainly reflects the strong growth, given the share price grew at 19% per year, compound, during the period. This suggests the market has well and truly recognized the progress the business has made. To our minds that makes Kraken Robotics worth investigating - it may have its best days ahead.
You can see how earnings and revenue have changed over time in the image below (click on the chart to see the exact values).
Balance sheet strength is crucial. It might be well worthwhile taking a look at our free report on how its financial position has changed over time.
A Different Perspective
While the broader market lost about 16% in the twelve months, Kraken Robotics shareholders did even worse, losing 47%. However, it could simply be that the share price has been impacted by broader market jitters. It might be worth keeping an eye on the fundamentals, in case there's a good opportunity. On the bright side, long term shareholders have made money, with a gain of 19% per year over half a decade. It could be that the recent sell-off is an opportunity, so it may be worth checking the fundamental data for signs of a long term growth trend. While it is well worth considering the different impacts that market conditions can have on the share price, there are other factors that are even more important. Take risks, for example - Kraken Robotics has 4 warning signs we think you should be aware of.
For those who like to find winning investments this free list of growing companies with recent insider purchasing, could be just the ticket.
Please note, the market returns quoted in this article reflect the market weighted average returns of stocks that currently trade on CA exchanges.
If you spot an error that warrants correction, please contact the editor at editorial-team@simplywallst.com. This article by Simply Wall St is general in nature. It does not constitute a recommendation to buy or sell any stock, and does not take account of your objectives, or your financial situation. Simply Wall St has no position in the stocks mentioned.
We aim to bring you long-term focused research analysis driven by fundamental data. Note that our analysis may not factor in the latest price-sensitive company announcements or qualitative material. Thank you for reading.
