
 Yahoo Finance
 Can You Imagine How Jubilant Input Capital's (CVE:INP) Shareholders Feel About Its 140% Share Price Gain?

Unless you borrow money to invest, the potential losses are limited. But if you pick the right stock, you can make a lot more than 100%. For example, the Input Capital Corp. (CVE:INP) share price has soared 140% in the last year. Most would be very happy with that, especially in just one year! Also pleasing for shareholders was the 119% gain in the last three months. The longer term returns have not been as good, with the stock price only 1.8% higher than it was three years ago.
See our latest analysis for Input Capital
We don't think that Input Capital's modest trailing twelve month profit has the market's full attention at the moment. We think revenue is probably a better guide. As a general rule, we think this kind of company is more comparable to loss-making stocks, since the actual profit is so low. It would be hard to believe in a more profitable future without growing revenues.
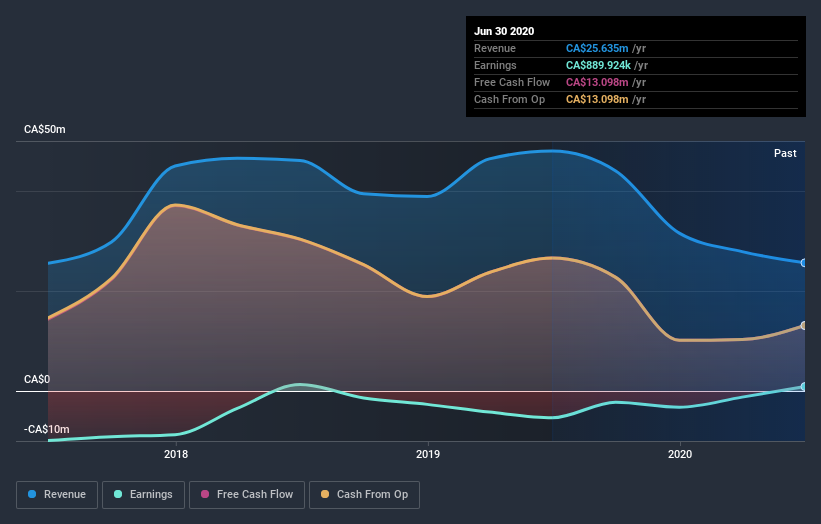
In the last year Input Capital saw its revenue shrink by 47%. We're a little surprised to see the share price pop 140% in the last year. It just goes to show the market doesn't always pay attention to the reported numbers. It's quite likely the revenue fall was already priced in, anyway.
You can see below how earnings and revenue have changed over time (discover the exact values by clicking on the image).
Take a more thorough look at Input Capital's financial health with this free report on its balance sheet.
What About Dividends?
As well as measuring the share price return, investors should also consider the total shareholder return (TSR). The TSR is a return calculation that accounts for the value of cash dividends (assuming that any dividend received was reinvested) and the calculated value of any discounted capital raisings and spin-offs. It's fair to say that the TSR gives a more complete picture for stocks that pay a dividend. We note that for Input Capital the TSR over the last year was 152%, which is better than the share price return mentioned above. The dividends paid by the company have thusly boosted the total shareholder return.
A Different Perspective
It's nice to see that Input Capital shareholders have received a total shareholder return of 152% over the last year. Of course, that includes the dividend. That certainly beats the loss of about 3.4% per year over the last half decade. We generally put more weight on the long term performance over the short term, but the recent improvement could hint at a (positive) inflection point within the business. It's always interesting to track share price performance over the longer term. But to understand Input Capital better, we need to consider many other factors. Take risks, for example - Input Capital has 4 warning signs we think you should be aware of.
Of course, you might find a fantastic investment by looking elsewhere. So take a peek at this free list of companies we expect will grow earnings.
Please note, the market returns quoted in this article reflect the market weighted average returns of stocks that currently trade on CA exchanges.
This article by Simply Wall St is general in nature. It does not constitute a recommendation to buy or sell any stock, and does not take account of your objectives, or your financial situation. We aim to bring you long-term focused analysis driven by fundamental data. Note that our analysis may not factor in the latest price-sensitive company announcements or qualitative material. Simply Wall St has no position in any stocks mentioned.
Have feedback on this article? Concerned about the content? Get in touch with us directly. Alternatively, email editorial-team@simplywallst.com.
