
 Yahoo Finance
 Can You Imagine How Chuffed Stoneridge's (NYSE:SRI) Shareholders Feel About Its 160% Share Price Gain?

Want to participate in a short research study? Help shape the future of investing tools and you could win a $250 gift card!
It might be of some concern to shareholders to see the Stoneridge, Inc. (NYSE:SRI) share price down 16% in the last month. But in stark contrast, the returns over the last half decade have impressed. We think most investors would be happy with the 160% return, over that period. Generally speaking the long term returns will give you a better idea of business quality than short periods can. Only time will tell if there is still too much optimism currently reflected in the share price.
View our latest analysis for Stoneridge
While markets are a powerful pricing mechanism, share prices reflect investor sentiment, not just underlying business performance. One way to examine how market sentiment has changed over time is to look at the interaction between a company's share price and its earnings per share (EPS).
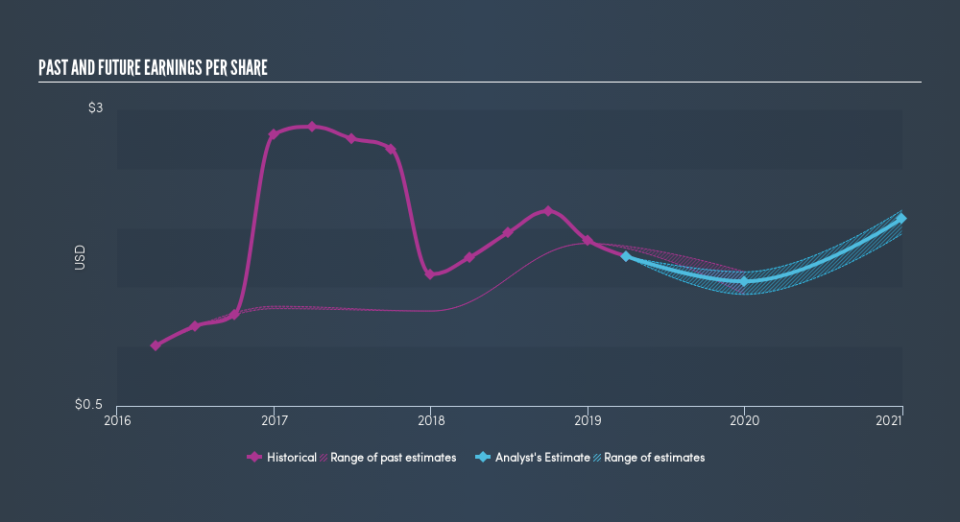
During five years of share price growth, Stoneridge achieved compound earnings per share (EPS) growth of 23% per year. This EPS growth is reasonably close to the 21% average annual increase in the share price. Therefore one could conclude that sentiment towards the shares hasn't morphed very much. Rather, the share price has approximately tracked EPS growth.
You can see how EPS has changed over time in the image below (click on the chart to see the exact values).
Before buying or selling a stock, we always recommend a close examination of historic growth trends, available here..
A Different Perspective
Investors in Stoneridge had a tough year, with a total loss of 12%, against a market gain of about 3.7%. However, keep in mind that even the best stocks will sometimes underperform the market over a twelve month period. Longer term investors wouldn't be so upset, since they would have made 21%, each year, over five years. It could be that the recent sell-off is an opportunity, so it may be worth checking the fundamental data for signs of a long term growth trend. If you would like to research Stoneridge in more detail then you might want to take a look at whether insiders have been buying or selling shares in the company.
Of course Stoneridge may not be the best stock to buy. So you may wish to see this free collection of growth stocks.
Please note, the market returns quoted in this article reflect the market weighted average returns of stocks that currently trade on US exchanges.
We aim to bring you long-term focused research analysis driven by fundamental data. Note that our analysis may not factor in the latest price-sensitive company announcements or qualitative material.
If you spot an error that warrants correction, please contact the editor at editorial-team@simplywallst.com. This article by Simply Wall St is general in nature. It does not constitute a recommendation to buy or sell any stock, and does not take account of your objectives, or your financial situation. Simply Wall St has no position in the stocks mentioned. Thank you for reading.
