
 Yahoo Finance
 Imaflex (CVE:IFX) Might Be Having Difficulty Using Its Capital Effectively
To find a multi-bagger stock, what are the underlying trends we should look for in a business? Ideally, a business will show two trends; firstly a growing return on capital employed (ROCE) and secondly, an increasing amount of capital employed. Basically this means that a company has profitable initiatives that it can continue to reinvest in, which is a trait of a compounding machine. However, after investigating Imaflex (CVE:IFX), we don't think it's current trends fit the mold of a multi-bagger.
Return On Capital Employed (ROCE): What Is It?
Just to clarify if you're unsure, ROCE is a metric for evaluating how much pre-tax income (in percentage terms) a company earns on the capital invested in its business. The formula for this calculation on Imaflex is:
Return on Capital Employed = Earnings Before Interest and Tax (EBIT) ÷ (Total Assets - Current Liabilities)
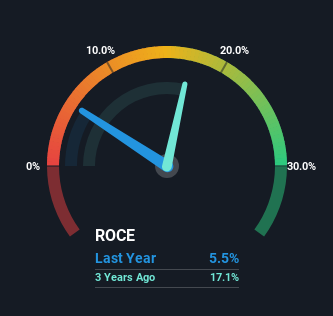
0.055 = CA$3.6m ÷ (CA$77m - CA$12m) (Based on the trailing twelve months to September 2023).
So, Imaflex has an ROCE of 5.5%. In absolute terms, that's a low return and it also under-performs the Packaging industry average of 12%.
Check out our latest analysis for Imaflex
In the above chart we have measured Imaflex's prior ROCE against its prior performance, but the future is arguably more important. If you'd like, you can check out the forecasts from the analysts covering Imaflex for free.
So How Is Imaflex's ROCE Trending?
On the surface, the trend of ROCE at Imaflex doesn't inspire confidence. Around five years ago the returns on capital were 16%, but since then they've fallen to 5.5%. Given the business is employing more capital while revenue has slipped, this is a bit concerning. If this were to continue, you might be looking at a company that is trying to reinvest for growth but is actually losing market share since sales haven't increased.
On a side note, Imaflex has done well to pay down its current liabilities to 16% of total assets. So we could link some of this to the decrease in ROCE. What's more, this can reduce some aspects of risk to the business because now the company's suppliers or short-term creditors are funding less of its operations. Since the business is basically funding more of its operations with it's own money, you could argue this has made the business less efficient at generating ROCE.
What We Can Learn From Imaflex's ROCE
In summary, we're somewhat concerned by Imaflex's diminishing returns on increasing amounts of capital. Despite the concerning underlying trends, the stock has actually gained 7.1% over the last five years, so it might be that the investors are expecting the trends to reverse. Either way, we aren't huge fans of the current trends and so with that we think you might find better investments elsewhere.
If you'd like to know about the risks facing Imaflex, we've discovered 2 warning signs that you should be aware of.
While Imaflex isn't earning the highest return, check out this free list of companies that are earning high returns on equity with solid balance sheets.
Have feedback on this article? Concerned about the content? Get in touch with us directly. Alternatively, email editorial-team (at) simplywallst.com.
This article by Simply Wall St is general in nature. We provide commentary based on historical data and analyst forecasts only using an unbiased methodology and our articles are not intended to be financial advice. It does not constitute a recommendation to buy or sell any stock, and does not take account of your objectives, or your financial situation. We aim to bring you long-term focused analysis driven by fundamental data. Note that our analysis may not factor in the latest price-sensitive company announcements or qualitative material. Simply Wall St has no position in any stocks mentioned.
