
 Yahoo Finance
 Imaflex (CVE:IFX) Is Achieving High Returns On Its Capital
If we want to find a potential multi-bagger, often there are underlying trends that can provide clues. Amongst other things, we'll want to see two things; firstly, a growing return on capital employed (ROCE) and secondly, an expansion in the company's amount of capital employed. Ultimately, this demonstrates that it's a business that is reinvesting profits at increasing rates of return. Speaking of which, we noticed some great changes in Imaflex's (CVE:IFX) returns on capital, so let's have a look.
What is Return On Capital Employed (ROCE)?
For those that aren't sure what ROCE is, it measures the amount of pre-tax profits a company can generate from the capital employed in its business. The formula for this calculation on Imaflex is:
Return on Capital Employed = Earnings Before Interest and Tax (EBIT) ÷ (Total Assets - Current Liabilities)
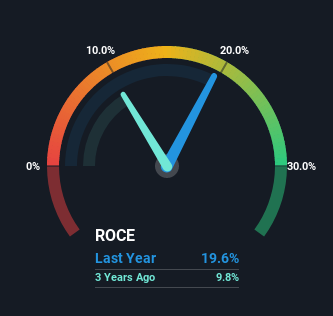
0.20 = CA$10m ÷ (CA$68m - CA$15m) (Based on the trailing twelve months to March 2022).
So, Imaflex has an ROCE of 20%. That's a fantastic return and not only that, it outpaces the average of 13% earned by companies in a similar industry.
View our latest analysis for Imaflex
Above you can see how the current ROCE for Imaflex compares to its prior returns on capital, but there's only so much you can tell from the past. If you'd like to see what analysts are forecasting going forward, you should check out our free report for Imaflex.
What Does the ROCE Trend For Imaflex Tell Us?
Imaflex is displaying some positive trends. The numbers show that in the last five years, the returns generated on capital employed have grown considerably to 20%. The company is effectively making more money per dollar of capital used, and it's worth noting that the amount of capital has increased too, by 96%. So we're very much inspired by what we're seeing at Imaflex thanks to its ability to profitably reinvest capital.
One more thing to note, Imaflex has decreased current liabilities to 22% of total assets over this period, which effectively reduces the amount of funding from suppliers or short-term creditors. Therefore we can rest assured that the growth in ROCE is a result of the business' fundamental improvements, rather than a cooking class featuring this company's books.
The Bottom Line
A company that is growing its returns on capital and can consistently reinvest in itself is a highly sought after trait, and that's what Imaflex has. And given the stock has remained rather flat over the last five years, there might be an opportunity here if other metrics are strong. So researching this company further and determining whether or not these trends will continue seems justified.
Like most companies, Imaflex does come with some risks, and we've found 2 warning signs that you should be aware of.
High returns are a key ingredient to strong performance, so check out our free list ofstocks earning high returns on equity with solid balance sheets.
Have feedback on this article? Concerned about the content? Get in touch with us directly. Alternatively, email editorial-team (at) simplywallst.com.
This article by Simply Wall St is general in nature. We provide commentary based on historical data and analyst forecasts only using an unbiased methodology and our articles are not intended to be financial advice. It does not constitute a recommendation to buy or sell any stock, and does not take account of your objectives, or your financial situation. We aim to bring you long-term focused analysis driven by fundamental data. Note that our analysis may not factor in the latest price-sensitive company announcements or qualitative material. Simply Wall St has no position in any stocks mentioned.
Join A Paid User Research Session
You’ll receive a US$30 Amazon Gift card for 1 hour of your time while helping us build better investing tools for the individual investors like yourself. Sign up here
