
 Yahoo Finance
 Illinois Tool Works (NYSE:ITW) stock performs better than its underlying earnings growth over last five years
If you buy and hold a stock for many years, you'd hope to be making a profit. Better yet, you'd like to see the share price move up more than the market average. Unfortunately for shareholders, while the Illinois Tool Works Inc. (NYSE:ITW) share price is up 42% in the last five years, that's less than the market return. Zooming in, the stock is actually down 4.1% in the last year.
Since it's been a strong week for Illinois Tool Works shareholders, let's have a look at trend of the longer term fundamentals.
Check out our latest analysis for Illinois Tool Works
There is no denying that markets are sometimes efficient, but prices do not always reflect underlying business performance. One imperfect but simple way to consider how the market perception of a company has shifted is to compare the change in the earnings per share (EPS) with the share price movement.
Over half a decade, Illinois Tool Works managed to grow its earnings per share at 6.3% a year. This EPS growth is reasonably close to the 7% average annual increase in the share price. Therefore one could conclude that sentiment towards the shares hasn't morphed very much. Rather, the share price has approximately tracked EPS growth.
The company's earnings per share (over time) is depicted in the image below (click to see the exact numbers).
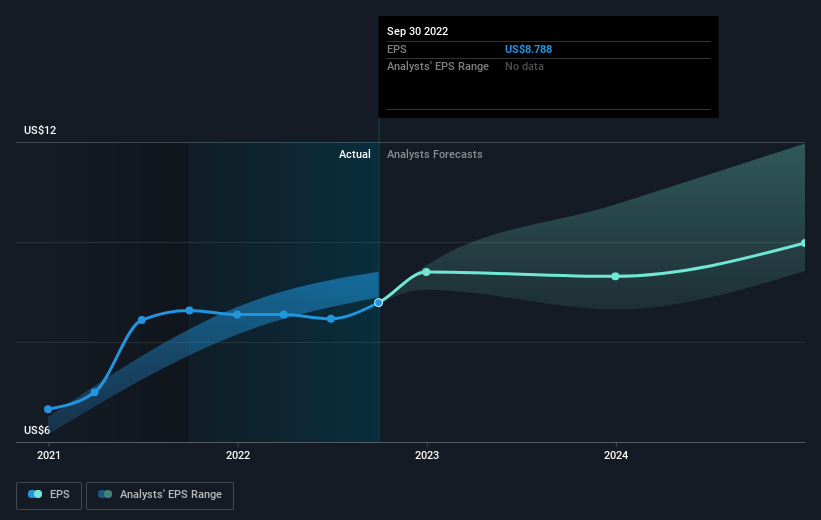
Dive deeper into Illinois Tool Works' key metrics by checking this interactive graph of Illinois Tool Works's earnings, revenue and cash flow.
What About Dividends?
As well as measuring the share price return, investors should also consider the total shareholder return (TSR). The TSR incorporates the value of any spin-offs or discounted capital raisings, along with any dividends, based on the assumption that the dividends are reinvested. Arguably, the TSR gives a more comprehensive picture of the return generated by a stock. We note that for Illinois Tool Works the TSR over the last 5 years was 60%, which is better than the share price return mentioned above. This is largely a result of its dividend payments!
A Different Perspective
While it's certainly disappointing to see that Illinois Tool Works shares lost 1.7% throughout the year, that wasn't as bad as the market loss of 21%. Of course, the long term returns are far more important and the good news is that over five years, the stock has returned 10% for each year. It could be that the business is just facing some short term problems, but shareholders should keep a close eye on the fundamentals. I find it very interesting to look at share price over the long term as a proxy for business performance. But to truly gain insight, we need to consider other information, too. Case in point: We've spotted 1 warning sign for Illinois Tool Works you should be aware of.
If you would prefer to check out another company -- one with potentially superior financials -- then do not miss this free list of companies that have proven they can grow earnings.
Please note, the market returns quoted in this article reflect the market weighted average returns of stocks that currently trade on US exchanges.
Have feedback on this article? Concerned about the content? Get in touch with us directly. Alternatively, email editorial-team (at) simplywallst.com.
This article by Simply Wall St is general in nature. We provide commentary based on historical data and analyst forecasts only using an unbiased methodology and our articles are not intended to be financial advice. It does not constitute a recommendation to buy or sell any stock, and does not take account of your objectives, or your financial situation. We aim to bring you long-term focused analysis driven by fundamental data. Note that our analysis may not factor in the latest price-sensitive company announcements or qualitative material. Simply Wall St has no position in any stocks mentioned.
Join A Paid User Research Session
You’ll receive a US$30 Amazon Gift card for 1 hour of your time while helping us build better investing tools for the individual investors like yourself. Sign up here
