
 Yahoo Finance
 Hyzon Motors (NASDAQ:HYZN) adds US$55m to market cap in the past 7 days, though investors from a year ago are still down 43%
Investors can approximate the average market return by buying an index fund. When you buy individual stocks, you can make higher profits, but you also face the risk of under-performance. Unfortunately the Hyzon Motors Inc. (NASDAQ:HYZN) share price slid 43% over twelve months. That contrasts poorly with the market return of 8.4%. Hyzon Motors hasn't been listed for long, so although we're wary of recent listings that perform poorly, it may still prove itself with time. Furthermore, it's down 18% in about a quarter. That's not much fun for holders. But this could be related to the weak market, which is down 7.4% in the same period.
On a more encouraging note the company has added US$55m to its market cap in just the last 7 days, so let's see if we can determine what's driven the one-year loss for shareholders.
View our latest analysis for Hyzon Motors
Hyzon Motors wasn't profitable in the last twelve months, it is unlikely we'll see a strong correlation between its share price and its earnings per share (EPS). Arguably revenue is our next best option. Shareholders of unprofitable companies usually expect strong revenue growth. Some companies are willing to postpone profitability to grow revenue faster, but in that case one does expect good top-line growth.
The company's revenue and earnings (over time) are depicted in the image below (click to see the exact numbers).
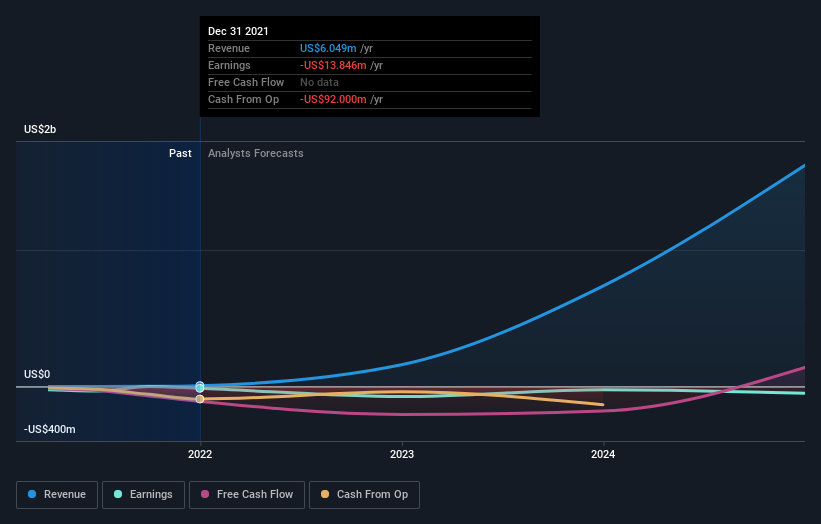
We consider it positive that insiders have made significant purchases in the last year. Having said that, most people consider earnings and revenue growth trends to be a more meaningful guide to the business. You can see what analysts are predicting for Hyzon Motors in this interactive graph of future profit estimates.
A Different Perspective
While Hyzon Motors shareholders are down 43% for the year, the market itself is up 8.4%. However, keep in mind that even the best stocks will sometimes underperform the market over a twelve month period. The share price decline has continued throughout the most recent three months, down 18%, suggesting an absence of enthusiasm from investors. Given the relatively short history of this stock, we'd remain pretty wary until we see some strong business performance. It's always interesting to track share price performance over the longer term. But to understand Hyzon Motors better, we need to consider many other factors. Consider for instance, the ever-present spectre of investment risk. We've identified 3 warning signs with Hyzon Motors (at least 1 which is concerning) , and understanding them should be part of your investment process.
If you like to buy stocks alongside management, then you might just love this free list of companies. (Hint: insiders have been buying them).
Please note, the market returns quoted in this article reflect the market weighted average returns of stocks that currently trade on US exchanges.
Have feedback on this article? Concerned about the content? Get in touch with us directly. Alternatively, email editorial-team (at) simplywallst.com.
This article by Simply Wall St is general in nature. We provide commentary based on historical data and analyst forecasts only using an unbiased methodology and our articles are not intended to be financial advice. It does not constitute a recommendation to buy or sell any stock, and does not take account of your objectives, or your financial situation. We aim to bring you long-term focused analysis driven by fundamental data. Note that our analysis may not factor in the latest price-sensitive company announcements or qualitative material. Simply Wall St has no position in any stocks mentioned.
