
 Yahoo Finance
 Husky Energy Inc.’s (TSE:HSE) Investment Returns Are Lagging Its Industry

Today we'll evaluate Husky Energy Inc. (TSE:HSE) to determine whether it could have potential as an investment idea. Specifically, we're going to calculate its Return On Capital Employed (ROCE), in the hopes of getting some insight into the business.
Firstly, we'll go over how we calculate ROCE. Then we'll compare its ROCE to similar companies. Then we'll determine how its current liabilities are affecting its ROCE.
What is Return On Capital Employed (ROCE)?
ROCE is a metric for evaluating how much pre-tax income (in percentage terms) a company earns on the capital invested in its business. In general, businesses with a higher ROCE are usually better quality. Ultimately, it is a useful but imperfect metric. Author Edwin Whiting says to be careful when comparing the ROCE of different businesses, since 'No two businesses are exactly alike.
How Do You Calculate Return On Capital Employed?
The formula for calculating the return on capital employed is:
Return on Capital Employed = Earnings Before Interest and Tax (EBIT) ÷ (Total Assets - Current Liabilities)
Or for Husky Energy:
0.03 = CA$934m ÷ (CA$37b - CA$5.1b) (Based on the trailing twelve months to September 2019.)
So, Husky Energy has an ROCE of 3.0%.
See our latest analysis for Husky Energy
Does Husky Energy Have A Good ROCE?
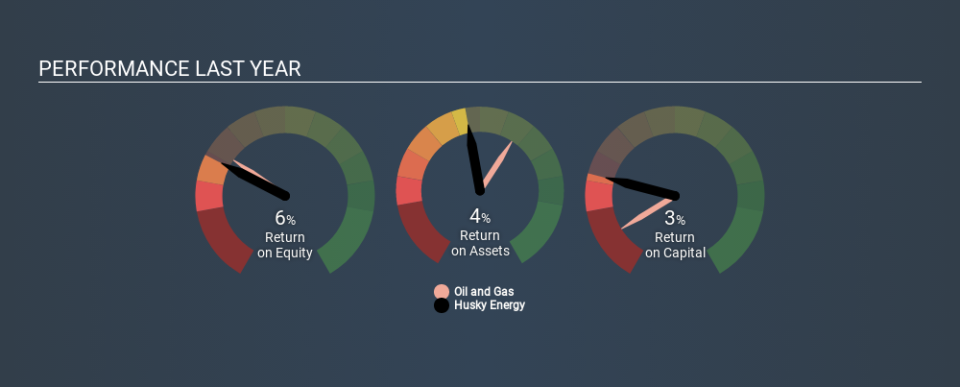
One way to assess ROCE is to compare similar companies. In this analysis, Husky Energy's ROCE appears meaningfully below the 5.3% average reported by the Oil and Gas industry. This performance could be negative if sustained, as it suggests the business may underperform its industry. Putting aside Husky Energy's performance relative to its industry, its ROCE in absolute terms is poor - considering the risk of owning stocks compared to government bonds. It is likely that there are more attractive prospects out there.
Husky Energy reported an ROCE of 3.0% -- better than 3 years ago, when the company didn't make a profit. This makes us wonder if the company is improving. You can see in the image below how Husky Energy's ROCE compares to its industry. Click to see more on past growth.
Remember that this metric is backwards looking - it shows what has happened in the past, and does not accurately predict the future. ROCE can be deceptive for cyclical businesses, as returns can look incredible in boom times, and terribly low in downturns. ROCE is, after all, simply a snap shot of a single year. Given the industry it operates in, Husky Energy could be considered cyclical. Since the future is so important for investors, you should check out our free report on analyst forecasts for Husky Energy.
Husky Energy's Current Liabilities And Their Impact On Its ROCE
Current liabilities include invoices, such as supplier payments, short-term debt, or a tax bill, that need to be paid within 12 months. Due to the way the ROCE equation works, having large bills due in the near term can make it look as though a company has less capital employed, and thus a higher ROCE than usual. To counter this, investors can check if a company has high current liabilities relative to total assets.
Husky Energy has total assets of CA$37b and current liabilities of CA$5.1b. As a result, its current liabilities are equal to approximately 14% of its total assets. With a very reasonable level of current liabilities, so the impact on ROCE is fairly minimal.
The Bottom Line On Husky Energy's ROCE
While that is good to see, Husky Energy has a low ROCE and does not look attractive in this analysis. Of course, you might find a fantastic investment by looking at a few good candidates. So take a peek at this free list of companies with modest (or no) debt, trading on a P/E below 20.
If you like to buy stocks alongside management, then you might just love this free list of companies. (Hint: insiders have been buying them).
If you spot an error that warrants correction, please contact the editor at editorial-team@simplywallst.com. This article by Simply Wall St is general in nature. It does not constitute a recommendation to buy or sell any stock, and does not take account of your objectives, or your financial situation. Simply Wall St has no position in the stocks mentioned.
We aim to bring you long-term focused research analysis driven by fundamental data. Note that our analysis may not factor in the latest price-sensitive company announcements or qualitative material. Thank you for reading.
