
 Yahoo Finance
 Is Husky Energy Inc.'s (TSE:HSE) P/E Ratio Really That Good?

The goal of this article is to teach you how to use price to earnings ratios (P/E ratios). We'll apply a basic P/E ratio analysis to Husky Energy Inc.'s (TSE:HSE), to help you decide if the stock is worth further research. What is Husky Energy's P/E ratio? Well, based on the last twelve months it is 7.51. That corresponds to an earnings yield of approximately 13.3%.
Check out our latest analysis for Husky Energy
How Do You Calculate A P/E Ratio?
The formula for price to earnings is:
Price to Earnings Ratio = Share Price ÷ Earnings per Share (EPS)
Or for Husky Energy:
P/E of 7.51 = CAD8.61 ÷ CAD1.15 (Based on the trailing twelve months to September 2019.)
Is A High P/E Ratio Good?
A higher P/E ratio means that buyers have to pay a higher price for each CAD1 the company has earned over the last year. That isn't a good or a bad thing on its own, but a high P/E means that buyers have a higher opinion of the business's prospects, relative to stocks with a lower P/E.
How Does Husky Energy's P/E Ratio Compare To Its Peers?
One good way to get a quick read on what market participants expect of a company is to look at its P/E ratio. If you look at the image below, you can see Husky Energy has a lower P/E than the average (11.1) in the oil and gas industry classification.
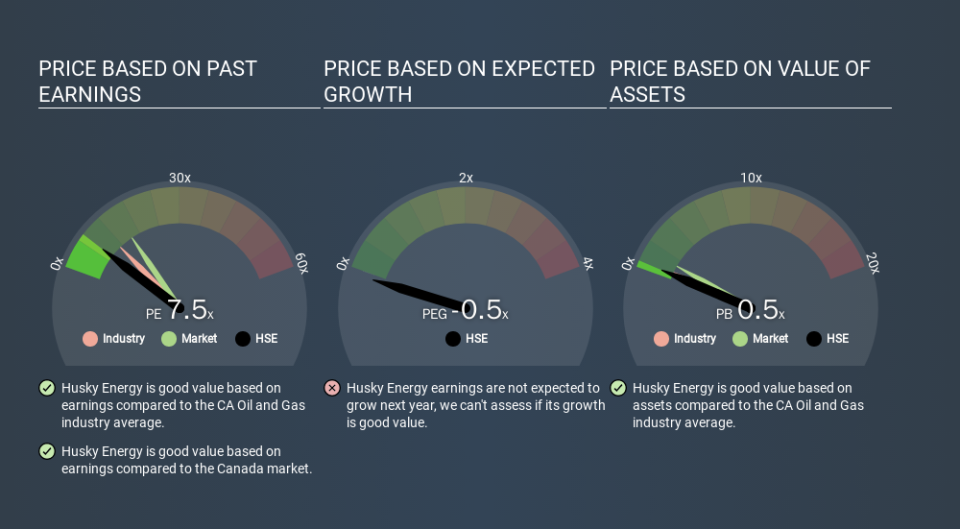
This suggests that market participants think Husky Energy will underperform other companies in its industry. Many investors like to buy stocks when the market is pessimistic about their prospects. You should delve deeper. I like to check if company insiders have been buying or selling.
How Growth Rates Impact P/E Ratios
Generally speaking the rate of earnings growth has a profound impact on a company's P/E multiple. That's because companies that grow earnings per share quickly will rapidly increase the 'E' in the equation. That means unless the share price increases, the P/E will reduce in a few years. So while a stock may look expensive based on past earnings, it could be cheap based on future earnings.
Husky Energy's earnings per share fell by 39% in the last twelve months. But EPS is up 22% over the last 3 years. And it has shrunk its earnings per share by 11% per year over the last five years. This could justify a pessimistic P/E.
Don't Forget: The P/E Does Not Account For Debt or Bank Deposits
Don't forget that the P/E ratio considers market capitalization. That means it doesn't take debt or cash into account. Hypothetically, a company could reduce its future P/E ratio by spending its cash (or taking on debt) to achieve higher earnings.
While growth expenditure doesn't always pay off, the point is that it is a good option to have; but one that the P/E ratio ignores.
So What Does Husky Energy's Balance Sheet Tell Us?
Husky Energy has net debt equal to 45% of its market cap. You'd want to be aware of this fact, but it doesn't bother us.
The Verdict On Husky Energy's P/E Ratio
Husky Energy trades on a P/E ratio of 7.5, which is below the CA market average of 15.4. The debt levels are not a major concern, but the lack of EPS growth is likely weighing on sentiment.
When the market is wrong about a stock, it gives savvy investors an opportunity. As value investor Benjamin Graham famously said, 'In the short run, the market is a voting machine but in the long run, it is a weighing machine. So this free visualization of the analyst consensus on future earnings could help you make the right decision about whether to buy, sell, or hold.
You might be able to find a better buy than Husky Energy. If you want a selection of possible winners, check out this free list of interesting companies that trade on a P/E below 20 (but have proven they can grow earnings).
If you spot an error that warrants correction, please contact the editor at editorial-team@simplywallst.com. This article by Simply Wall St is general in nature. It does not constitute a recommendation to buy or sell any stock, and does not take account of your objectives, or your financial situation. Simply Wall St has no position in the stocks mentioned.
We aim to bring you long-term focused research analysis driven by fundamental data. Note that our analysis may not factor in the latest price-sensitive company announcements or qualitative material. Thank you for reading.
