
 Yahoo Finance
 Hudbay Announces Positive Preliminary Economic Assessment for its Mason Copper Project
Figure 1: Mason Location Map
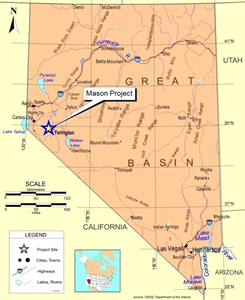
The Mason project is located in west-central Nevada, approximately 75 kilometres southeast of Reno and seven kilometres west of the town of Yerington. The area is known as the historic Yerington Mining District due to known historical mining activities.
Figure 2: Mason Land Package
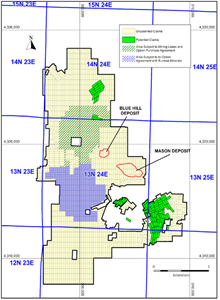
Through a combination of patented and unpatented mineral claims on public and private land, the Mason project has a total area of approximately 13,820 hectares, including the land acquired through the Mason Valley acquisition in 2019.
Figure 3: Mason Proposed Site Layout
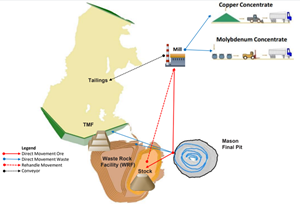
Proposed site layout including the location of the Mason open pit mine, the processing plant, waste rock facility and tailings management facility.
Figure 4: Mason Valley Historical Mines
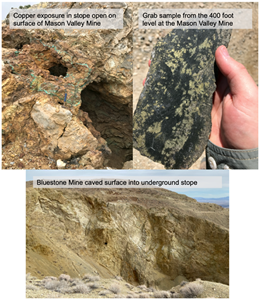
The Mason Valley property consists of several past-producing mines with visuals of copper mineralization in the area.
27-year mine life with average annual copper production of approximately 140,000 tonnes over the first ten years of full production.
Mason has the potential to more than double Hudbay’s current copper production levels, and if brought into production, Mason is expected to become the third largest copper mine in the United States.
After-tax net present value (10%) of $519 million and 13.7% internal rate of return at $3.10 per pound copper, which increases to $773 million and 15.4%, respectively, at $3.25 per pound copper.
Mine plan assumes the construction of a 120,000 tonnes per day conventional flotation concentrator and an initial capital cost estimate of approximately $2.1 billion.
The mine plan includes 1.1 billion tonnes at 0.34% copper-equivalenti, 98% of which is from the measured and indicated categories.
Mason’s 2.2 billion tonne measured and indicated resource estimate is one of the largest greenfield copper projects in the Americas.
Opportunities to further enhance project economics through exploration for higher-grade satellite deposits on Hudbay’s prospective land package in Nevada.
Mason is a viable long-term option for potential future development and a strong component of Hudbay’s pipeline of long-term growth opportunities in mining friendly jurisdictions.
TORONTO, April 06, 2021 (GLOBE NEWSWIRE) -- Hudbay Minerals Inc. (“Hudbay” or the “company”) (TSX, NYSE: HBM) today announced the results of its preliminary economic assessment (“PEA”) of its 100%-owned Mason copper project located in Nevada, United States. All dollar amounts are in US dollars, unless otherwise noted.
“The Mason PEA demonstrates the success of Hudbay’s consistent growth strategy and our team’s ability to create value from accretive acquisitions of high-quality copper projects in mining-friendly jurisdictions,” said Peter Kukielski, Hudbay’s President and Chief Executive Officer. “We added Mason to our development pipeline portfolio in 2018 and have since leveraged our integrated core competencies of exploration, mine planning and project development to demonstrate that Mason is a quality long-term development project in our robust organic growth pipeline.”
Hudbay’s Mason Development Strategy
The Mason project is a large greenfield copper deposit located in the historic Yerington District of Nevada and is one of the largest undeveloped copper porphyry deposits in North America. Mason’s measured and indicated mineral resource estimates are approximately twice the size of Hudbay’s Constancia and Rosemont deposits. Hudbay views the Mason project as a long-term option for future development and a strong component of its pipeline of long-term growth opportunities in mining friendly jurisdictions. Please refer to Figure 1 for a map showing the location of the Mason project.
In 2017, Hudbay made a $2 million toe-hold equity investment in Mason Resources Corp., the entity that owned the Mason project at that time. In October 2018, Hudbay entered into an agreement to acquire the remaining 86% of the issued and outstanding common shares of Mason Resources Corp. that it didn’t already own for approximately $15 million. The acquisition of Mason was completed by way of a plan of arrangement in December 2018. Since acquiring Mason, Hudbay has consolidated a prospective package of patented and unpatented mining claims contiguous to the Mason project in two private transactions in 2019 and 2020, including a property called Mason Valley, as shown in Figure 2. In March 2021, Hudbay announced an updated measured and indicated resource estimate of 2.2 billion tonnes at 0.29% copper at Mason, based on a revised resource model and an updated mine plan constructed by Hudbay personnel using the same methods applied at Constancia. The company has also advanced a number of technical studies to support the completion of its 2021 PEA.
Mason 2021 PEA Summary
The 2021 Mason PEA contemplates a 27-year mine life with average annual copper production of approximately 140,000 tonnes over the first ten years of full production. At a copper price of $3.10 per pound, the after-tax net present value using a 10% discount rate is $519 million and the internal rate of return is 13.7%. The valuation metrics are highly sensitive to the copper price and at a price of $3.25 per pound, the after-tax net present value using a 10% discount rate increases to $773 million and the internal rate of return increases to 15.4%.
A summary of key valuation, production and cost details from the 2021 PEA can be found below. For further details, including metrics provided on an annual basis, please refer to the section titled “Detailed Cash Flow Model” at the end of this news release.
Summary of Key Metrics (at $3.10/lb Cu) | Unit | Value |
Valuation Metrics (Unlevered)1 | ||
Net present value @ 8% (after-tax) | $ millions | $945 |
Net present value @ 10% (after-tax) | $ millions | $519 |
Internal rate of return (after-tax) | % | 13.7% |
Payback period | # years | 9.0 |
EBITDA (annual LOM avg.) | $ millions | $339 |
Project Metrics | ||
Initial capital2 | $ millions | $2,079 |
Operating Metrics | ||
Copper production (annual avg. over first 10 full years) | 000 tonnes | 138.7 |
Copper production (annual LOM avg.) | 000 tonnes | 112.3 |
Copper recovery | % | 90.0% |
Sustaining capital (annual LOM avg.) | $ millions | $21 |
Cash cost3 (LOM avg.) | $/lb Cu | $1.61 |
Sustaining cash cost3 (LOM avg.) | $/lb Cu | $1.76 |
Mining unit cost4 (LOM avg.) | $/t moved | $1.20 |
Milling unit cost (LOM avg.) | $/t milled | $4.85 |
G&A unit cost (LOM avg.) | $/t milled | $1.15 |
Combined unit cost5 (LOM avg.) | $/t milled | $8.66 |
Note: “LOM” refers to life-of-mine total.
1 Calculated assuming the following commodity prices: copper price of $3.10 per pound, gold price of $1,500 per ounce, silver price of $18.00 per ounce and molybdenum price of $10.00 per pound.
2 Initial capital assumes a 20% contingency.
3 Cash cost and sustaining cash cost, net of by-product credits, per pound of copper produced. By-product credits calculated using the following commodity prices: gold price of $1,500 per ounce, silver price of $18.00 per ounce and molybdenum price of $10.00 per pound. Sustaining cash cost includes sustaining capital expenditures and royalties. Cash cost and sustaining cash cost are non-IFRS financial performance measures with no standardized definition under IFRS. For further details on why Hudbay believes cash costs are a useful performance indicator, please refer to the company's most recent Management's Discussion and Analysis for the three and twelve months ended December 31, 2020.
4 Before the impact of capitalized stripping.
5 Combined mine, mill and general and administrative costs per tonne of ore milled, after the impact of capitalized stripping.
Cu Price Sensitivity | Unit | $3.00/lb | $3.10/lb | $3.25/lb | $3.50/lb | $3.75/lb | $4.00/lb |
Valuation Metrics | |||||||
Net present value1 @ 8% | $ millions | $739 | $945 | $1,253 | $1,761 | $2,264 | $2,766 |
Net present value1 @ 10% | $ millions | $350 | $519 | $773 | $1,191 | $1,606 | $2,019 |
Internal rate of return1 | % | 12.5% | 13.7 % | 15.4% | 18.1% | 20.7% | 23.1% |
Payback period | # years | 9.5 | 9.0 | 8.4 | 7.7 | 7.1 | 6.7 |
EBITDA (annual LOM avg.) | $ millions | $315 | $339 | $374 | $434 | $493 | $553 |
1 Net present value and internal rate of return are shown on an after-tax basis.
Overview of Proposed Operation
The Mason deposit is a large tonnage, copper-molybdenum deposit and is planned to be a traditional open pit shovel/truck operation with a copper sulphide mineral processing plant producing commercial grade copper and molybdenum concentrate. The plant is designed to operate at a throughput rate of 120,000 tonnes per day. Please refer to Figure 3 for a map of the proposed site layout.
Mining operations in the pit are designed to be performed from 15 and 30-metre-high benches using large-scale mining equipment including 10 5/8-inch diameter rotary blast hole drills, 74 cubic-yard electric mining shovels, a 55 cubic-yard hydraulic shovel, a 37 cubic-yard front-end loader and 290-tonne capacity haul trucks. During the 27-year operation, the mine plan achieves peak mining rates until year 13, then reduces by about half of the original mining rate from year 14 to 20 as the strip ratio drops. The remaining seven years assumes the processing of rehandled ore from stockpiles.
The concentrator design consists of conventional crushing and milling, followed by rougher and cleaner froth flotation, and is a similar flowsheet to that used at Hudbay’s Constancia mine in Peru. The proposed site layout assumes the plant will be located to the northwest of the open pit, northeast of the waste rock facility and east of the tailings management facility. Haul trucks will dump ore at the primary crusher, which will feed the concentrator via overland conveyor.
Operating costs were developed by Hudbay based on a bottom-up approach utilizing price quotes from suppliers and local costs for labour. Mine operating costs were validated against actual costs at Constancia and other similar projects and operations.
Mineral Resource Estimate
The PEA and mine plan were based on a revised resource model which was used to publish Hudbay’s first compiled updated resource estimate for Mason. The resource model was constructed using the same methods Hudbay applied at Constancia. Based on this new model, including resource classification criteria calibrated on historical performance at Constancia, control of grade over-smoothing in the central zone of the deposit and the use of a lower cut-off grade, the measured and indicated resources increased to 2.2 billion tonnes at 0.29% copper, from 1.4 billion tonnes at 0.32% copper previously.
The current mineral resource estimates for Mason, based on the revised resource model as of January 1, 2021, are summarized below.
Mason Project | Tonnes | Cu Grade | Mo Grade | Au Grade | Ag Grade | |
Measured | 1,417,000,000 | 0.29 | 59 | 0.031 | 0.66 | |
Indicated | 801,000,000 | 0.30 | 80 | 0.025 | 0.57 | |
Total Measured and Indicated | 2,219,000,000 | 0.29 | 67 | 0.029 | 0.63 | |
Inferred | 237,000,000 | 0.24 | 78 | 0.033 | 0.73 | |
Note: totals may not add up correctly due to rounding.
1 Mineral resource estimates that are not mineral reserves do not have demonstrated economic viability. Mineral resource estimates do not include factors for mining recovery or dilution.
2 Metal prices of $3.10 per pound copper, $10.00 per pound molybdenum, $1,500 per ounce gold, and $18.00 per ounce silver were used to estimate mineral resources.
3 Mineral resource estimates are reported as 20 metres by 20 metres by 15 meters blocks above cut-off using a minimum NSR per tonne of $6.25.
Regional Upside Potential
There is opportunity to further enhance the project economics through exploration for higher grade satellite deposits on Hudbay’s prospective land package in Nevada, including Mason Valley. The Mason Valley property hosts several historical underground copper mines that were in production in the early 1900s. Much of the Mason Valley property is located on Hudbay’s wholly owned private lands and contains highly prospective skarn mineralization. Mason Valley presents a similar opportunity to Hudbay’s Copper World property in Arizona, where the company has recently announced the discovery of four mineral deposits in a historical mining district. Historical drilling and production records from the past producing mines at Mason Valley indicate the mineralization is high grade and starts at or near surface (please refer to Figure 4). In 2015, Metal Bank Limited optioned the Mason Valley property and conducted a limited campaign of nine reverse circulation drillholes at the Bluestone prospect with the objective to define the extent of the high-grade copper mineralization. Two notable holes intersected 42 metres of 1.51% copper and 34 metres of 0.61% copper, both starting from surface.
The company also owns the Blue Hill copper oxide deposit located 1.5 kilometres northwest of the Mason deposit, which was not included in the 2021 PEA and may present an opportunity to add an oxide component to the Mason project design in the future.
Next Steps
Hudbay continues to compile and interpret historical data relating to its land package near Mason. Once this is done, the company expects to complete a geophysical survey to refine the exploration targets in preparation for a potential initial drilling campaign later this year. The company will also continue to advance its local stakeholder engagement program while advancing trade-off studies to support future pre-feasibility work on the project.
Non-IFRS Financial Performance Measures
Cash cost and sustaining cash cost per pound of copper produced are shown because the company believes they help investors and management assess the performance of its operations, including the margin generated by the operations and the company. Unit operating costs are shown because these measures are used by the company as a key performance indicator to assess the performance of its mining and processing operations. These measures do not have a meaning prescribed by IFRS and are therefore unlikely to be comparable to similar measures presented by other issuers. These measures should not be considered in isolation or as a substitute for measures prepared in accordance with IFRS and are not necessarily indicative of operating profit or cash flow from operations as determined under IFRS. Other companies may calculate these measures differently. For further details on these measures, please refer to page 53 of Hudbay’s management’s discussion and analysis for the year ended December 31, 2020 available on SEDAR at www.sedar.com.
Qualified Person and NI 43-101
The scientific and technical information contained in this news release related to the Mason project has been approved by Olivier Tavchandjian, P. Geo, Hudbay’s Vice-President, Exploration and Geology. Mr. Tavchandjian is a qualified person pursuant to NI 43 101. The company expects to voluntarily file a National Instrument 43-101 technical report on Mason in the coming months.
This preliminary economic assessment is preliminary in nature, includes inferred resources that are considered too speculative to have the economic considerations applied to them that would enable them to be categorized as mineral reserves and there is no certainty the preliminary economic assessment will be realized.
Note to United States Investors
This news release has been prepared in accordance with the requirements of the securities laws in effect in Canada, which differ from the requirements of United States securities laws. Canadian reporting requirements for disclosure of mineral properties are governed by the Canadian Securities Administrators’ National Instrument 43-101 Standards of Disclosure for Mineral Projects (“NI 43-101”).
For this reason, information contained in this news release in respect of the Mason project may not be comparable to similar information made public by United States companies subject to the reporting and disclosure requirements under the United States federal securities laws and the rules and regulations thereunder. For further information on the differences between the disclosure requirements for mineral properties under the United States federal securities laws and NI 43-101, please refer to the company’s AIF, a copy of which has been filed under Hudbay’s profile on SEDAR at www.sedar.com and the company’s Form 40-F, a copy of which has been filed on EDGAR at www.edgar.com.
Forward-Looking Information
This news release contains forward-looking information within the meaning of applicable Canadian and United States securities legislation. All information contained in this news release, other than statements of current and historical fact, is forward-looking information. Often, but not always, forward-looking information can be identified by the use of words such as “plans”, “expects”, “budget”, “guidance”, “scheduled”, “estimates”, “forecasts”, “strategy”, “target”, “intends”, “objective”, “goal”, “understands”, “anticipates” and “believes” (and variations of these or similar words) and statements that certain actions, events or results “may”, “could”, “would”, “should”, “might” “occur” or “be achieved” or “will be taken” (and variations of these or similar expressions). All of the forward-looking information in this news release is qualified by this cautionary note.
Forward-looking information includes, but is not limited to, the results of the Mason PEA, including the production, operating cost capital cost and cash cost estimates, metal price assumptions, cash flow projections, metal recoveries, mine life projections and production rates for the Mason project, the planned design of the Mason project, the potential to further enhance the economics of the Mason project, including through the exploration of the Mason Valley property, the possibility of bringing the Mason project into production and its position as compared to other copper mines in the United States and expectations regarding future work programs to advance the Mason project. Forward-looking information is not, and cannot be, a guarantee of future results or events. Forward-looking information is based on, among other things, opinions, assumptions, estimates and analyses that, while considered reasonable by us at the date the forward-looking information is provided, inherently are subject to significant risks, uncertainties, contingencies and other factors that may cause actual results and events to be materially different from those expressed or implied by the forward-looking information.
The material factors or assumptions that Hudbay identified and were applied by the company in drawing conclusions or making forecasts or projections set out in the forward-looking information include, but are not limited to:
the success of exploration and development activities at Mason;
the accuracy of geological, mining and metallurgical estimates;
anticipated metals prices and the costs of production;
the supply and demand for metals Hudbay produces;
the supply and availability of all forms of energy and fuels at reasonable prices;
no significant unanticipated operational or technical difficulties;
the availability of additional financing, if needed;
the availability of personnel for the company’s exploration, development and operational projects and ongoing employee relations;
maintaining good relations with the communities in which the company operates, including the neighbouring communities and local governments in Nevada;
no significant unanticipated challenges with stakeholders at the Mason project;
no significant unanticipated events or changes relating to regulatory, environmental, health and safety matters;
no contests over title to Hudbay’s properties, including as a result of rights or claimed rights of Indigenous peoples or challenges to the validity of its unpatented mining claims;
no significant unanticipated litigation;
certain tax matters, including, but not limited to the mining tax regime in Nevada; and
no significant and continuing adverse changes in general economic conditions or conditions in the financial markets (including commodity prices and foreign exchange rates).
The risks, uncertainties, contingencies and other factors that may cause actual results to differ materially from those expressed or implied by the forward-looking information may include, but are not limited to, risks associated with the COVID-19 pandemic and its effect on the company’s operations, financial condition, projects and prospects, the possibility of a global recession arising from the COVID-19 pandemic and attempts to control it, risks generally associated with the mining industry, such as economic factors (including future commodity prices, currency fluctuations, energy prices and general cost escalation), uncertainties related to the development and operation of the company’s projects, risks in respect of Indigenous and community relations, rights and title claims, risks in respect of permitting the Mason project, uncertainties related to the geology, continuity, grade and estimates of mineral reserves and resources, and the potential for variations in grade and recovery rates, as well as the risks discussed under the heading “Risk Factors” in the company’s AIF.
Should one or more risk, uncertainty, contingency or other factor materialize or should any factor or assumption prove incorrect, actual results could vary materially from those expressed or implied in the forward-looking information. Accordingly, you should not place undue reliance on forward-looking information. The company does not assume any obligation to update or revise any forward-looking information after the date of this news release or to explain any material difference between subsequent actual events and any forward-looking information, except as required by applicable law.
About Hudbay
Hudbay (TSX, NYSE: HBM) is a diversified mining company primarily producing copper concentrate (containing copper, gold and silver) and zinc metal. Directly and through its subsidiaries, Hudbay owns three polymetallic mines, four ore concentrators and a zinc production facility in northern Manitoba and Saskatchewan (Canada) and Cusco (Peru), and copper projects in Arizona and Nevada (United States). The company’s growth strategy is focused on the exploration, development, operation and optimization of properties it already controls, as well as other mineral assets it may acquire that fit its strategic criteria. Hudbay’s vision is to be a responsible, top-tier operator of long-life, low-cost mines in the Americas. Hudbay’s mission is to create sustainable value through the acquisition, development and operation of high-quality, long-life deposits with exploration potential in jurisdictions that support responsible mining, and to see the regions and communities in which the company operates benefit from its presence. The company is governed by the Canada Business Corporations Act and its shares are listed under the symbol "HBM" on the Toronto Stock Exchange, New York Stock Exchange and Bolsa de Valores de Lima. Further information about Hudbay can be found on www.hudbay.com.
For investor and media inquiries, please contact:
Candace Brûlé
Director, Investor Relations
(416) 814-4387
candace.brule@hudbay.com
Detailed Cash Flow Model
Mason Cash Flow Model | Unit | LOM | Y-03 | Y-02 | Y-01 | Y01 | Y02 | Y03 | Y04 | Y05 | Y06 | Y07 | |||||||||||
Mining Activities | |||||||||||||||||||||||
Ore mined | 000 tonnes | 1,133,427 | - | - | - | 41,929 | 45,929 | 60,172 | 64,130 | 57,167 | 56,756 | 53,605 | |||||||||||
Waste mined | 000 tonnes | 1,448,540 | - | - | - | 117,871 | 113,781 | 99,828 | 95,870 | 102,833 | 103,244 | 106,395 | |||||||||||
Rehandle | 000 tonnes | 301,531 | - | - | - | 200 | 290 | - | - | - | - | - | |||||||||||
Pre-strip – Ore mined | 000 tonnes | 3,012 | - | - | 3,012 | - | - | - | - | - | - | - | |||||||||||
Pre-strip – Waste mined | 000 tonnes | 116,988 | - | - | 116,988 | - | - | - | - | - | - | - | |||||||||||
Mineral moved | 000 tonnes | 3,003,498 | - | - | 120,000 | 160,000 | 160,000 | 160,000 | 160,000 | 160,000 | 160,000 | 160,000 | |||||||||||
Strip ratio excl. pre-strip | waste/ore | 1.28 | - | - | - | 2.81 | 2.48 | 1.66 | 1.49 | 1.80 | 1.82 | 1.98 | |||||||||||
Mining rate | 000 t/day | 353 | - | - | 329 | 438 | 438 | 438 | 438 | 438 | 438 | 438 | |||||||||||
Unit cost | $/t moved | 1.20 | - | - | - | 1.20 | 1.20 | 1.20 | 1.25 | 1.25 | 1.25 | 1.29 | |||||||||||
Milling Activities | |||||||||||||||||||||||
Ore milled | 000 tonnes | 1,136,439 | - | - | - | 36,500 | 43,800 | 43,800 | 43,800 | 43,800 | 43,800 | 43,800 | |||||||||||
Headgrade – Cu | % | 0.296% | - | - | - | 0.310% | 0.381% | 0.356% | 0.380% | 0.367% | 0.369% | 0.364% | |||||||||||
Headgrade – Mo | % | 0.006% | - | - | - | 0.006% | 0.008% | 0.005% | 0.007% | 0.003% | 0.002% | 0.003% | |||||||||||
Headgrade – Au | g/tonne | 0.032 | - | - | - | 0.013 | 0.026 | 0.024 | 0.027 | 0.042 | 0.029 | 0.025 | |||||||||||
Headgrade – Ag | g/tonne | 0.667 | - | - | - | 0.381 | 0.516 | 0.527 | 0.659 | 0.826 | 0.590 | 0.597 | |||||||||||
Milling Rate | 000 t/day | 115 | - | - | - | 100 | 120 | 120 | 120 | 120 | 120 | 120 | |||||||||||
Unit cost | $/t milled | 4.85 | - | - | - | 4.90 | 4.90 | 4.90 | 4.90 | 4.90 | 4.90 | 4.90 | |||||||||||
Concentrates Produced & Sold | |||||||||||||||||||||||
Copper concentrate | 000 tonnes | 10,108 | - | - | - | 339 | 501 | 468 | 499 | 482 | 485 | 479 | |||||||||||
Contained metal – Cu | 000 tonnes | 3,033 | - | - | - | 102 | 150 | 140 | 150 | 145 | 145 | 144 | |||||||||||
Contained metal – Au | 000 ounces | 696 | - | - | - | 9 | 22 | 20 | 23 | 36 | 24 | 21 | |||||||||||
Contained metal – Ag | 000 ounces | 14,630 | - | - | - | 268 | 436 | 445 | 556 | 698 | 499 | 504 | |||||||||||
Payable metal - Cu | 000 tonnes | 2,926 | - | - | - | 98 | 145 | 135 | 145 | 140 | 140 | 139 | |||||||||||
Payable metal – Au | 000 ounces | 618 | - | - | - | - | 20 | 18 | 21 | 32 | 22 | 19 | |||||||||||
Payable metal – Ag | 000 ounces | 12,133 | - | - | - | - | - | - | 501 | 628 | 449 | 454 | |||||||||||
Moly concentrate | 000 tonnes | 64 | - | - | - | 2 | 3 | 2 | 3 | 1 | 1 | 1 | |||||||||||
Contained metal – Mo | 000 tonnes | 32 | - | - | - | 1 | 2 | 1 | 1 | 1 | 1 | 1 | |||||||||||
Payable metal – Mo | 000 tonnes | 31 | - | - | - | 1 | 2 | 1 | 1 | 1 | 1 | 1 | |||||||||||
Capital Costs | |||||||||||||||||||||||
Project capital | $ millions | 2,079 | 228 | 839 | 1,012 | - | - | - | - | - | - | - | |||||||||||
Sustaining capital | $ millions | 541 | - | - | - | 29 | 34 | 34 | 34 | 34 | 29 | 29 | |||||||||||
Deferred stripping | $ millions | 427 | - | - | - | 77 | 66 | 28 | 17 | 37 | 38 | 49 | |||||||||||
Total | $ millions | 3,046 | 228 | 839 | 1,012 | 106 | 100 | 62 | 51 | 71 | 67 | 78 | |||||||||||
Operating Costs | |||||||||||||||||||||||
Mining | $ millions | 3,458 | - | - | - | 192 | 192 | 192 | 200 | 200 | 200 | 206 | |||||||||||
Deferred stripping | $ millions | (427) | - | - | - | (77) | (66) | (28) | (17) | (37) | (38) | (49) | |||||||||||
Milling | $ millions | 5,506 | - | - | - | 179 | 215 | 215 | 215 | 215 | 215 | 215 | |||||||||||
G&A | $ millions | 1,272 | - | - | - | 46 | 55 | 55 | 55 | 55 | 55 | 55 | |||||||||||
Closure + surety bonds | $ millions | 153 | 1 | 1 | 1 | 1 | 1 | 1 | 1 | 1 | 1 | 1 | |||||||||||
Total | $ millions | 9,963 | 1 | 1 | 1 | 340 | 396 | 435 | 453 | 433 | 432 | 427 | |||||||||||
Cost Metrics | |||||||||||||||||||||||
Cash cost | $/lb Cu prod. | 1.61 | - | - | - | 1.81 | 1.40 | 1.65 | 1.56 | 1.52 | 1.58 | 1.59 | |||||||||||
Sustaining cash cost | $/lb Cu prod. | 1.76 | - | - | - | 2.30 | 1.72 | 1.86 | 1.73 | 1.76 | 1.81 | 1.85 | |||||||||||
Combined unit cost | $/t milled | 8.66 | - | - | - | 9.32 | 9.05 | 9.93 | 10.34 | 9.89 | 9.86 | 9.76 | |||||||||||
Cash Flow Summary | |||||||||||||||||||||||
Gross revenue | $ millions | 21,838 | - | - | - | 697 | 1,059 | 975 | 1,061 | 1,030 | 1,011 | 998 | |||||||||||
TC/RC | $ millions | (1,417) | - | - | - | (47) | (70) | (64) | (70) | (66) | (65) | (65) | |||||||||||
Freight | $ millions | (1,320) | - | - | - | (44) | (65) | (61) | (65) | (63) | (63) | (62) | |||||||||||
NSR royalty | $ millions | (76) | - | - | - | (2) | (4) | (3) | (4) | (4) | (4) | (3) | |||||||||||
Operating costs | $ millions | (9,963) | (1) | (1) | (1) | (340) | (396) | (435) | (453) | (433) | (432) | (427) | |||||||||||
Federal tax | $ millions | (576) | - | - | - | - | - | (2) | (2) | (5) | (16) | (15) | |||||||||||
State tax | $ millions | (314) | - | - | - | - | - | (6) | (5) | (10) | (9) | (8) | |||||||||||
WC changes | $ millions | 0 | 37 | 100 | 28 | (139) | (16) | 6 | (5) | 2 | 1 | 2 | |||||||||||
Cash from operations | $ millions | 8,173 | 36 | 99 | 27 | 123 | 507 | 409 | 458 | 451 | 423 | 419 | |||||||||||
Capital costs | $ millions | (3,046) | (228) | (839) | (1,012) | (106) | (100) | (62) | (51) | (71) | (67) | (78) | |||||||||||
Unlevered free cash flow | $ millions | 5,127 | (192) | (740) | (984) | 17 | 407 | 348 | 407 | 380 | 356 | 342 | |||||||||||
Mason Cash Flow Model | Unit | Y08 | Y09 | Y10 | Y11 | Y12 | Y13 | Y14 | Y15 | Y16 | Y17 | Y18 | |||||||||||
Mining Activities | |||||||||||||||||||||||
Ore mined | 000 tonnes | 61,926 | 60,606 | 75,486 | 69,209 | 72,697 | 60,446 | 56,742 | 65,268 | 69,051 | 62,323 | 45,688 | |||||||||||
Waste mined | 000 tonnes | 98,074 | 99,394 | 84,514 | 90,791 | 87,303 | 99,554 | 94,242 | 44,732 | 6,993 | 746 | 103 | |||||||||||
Rehandle | 000 tonnes | - | - | - | - | - | - | - | - | - | - | - | |||||||||||
Pre-strip – Ore mined | 000 tonnes | - | - | - | - | - | - | - | - | - | - | - | |||||||||||
Pre-strip – Waste mined | 000 tonnes | - | - | - | - | - | - | - | - | - | - | - | |||||||||||
Mineral moved | 000 tonnes | 160,000 | 160,000 | 160,000 | 160,000 | 160,000 | 160,000 | 150,983 | 110,000 | 76,043 | 63,069 | 45,791 | |||||||||||
Strip ratio excl. pre-strip | waste/ore | 1.58 | 1.64 | 1.12 | 1.31 | 1.20 | 1.65 | 1.66 | 0.69 | 0.10 | 0.01 | 0.00 | |||||||||||
Mining rate | 000 t/day | 438 | 438 | 438 | 438 | 438 | 438 | 414 | 301 | 208 | 173 | 125 | |||||||||||
Unit cost | $/t moved | 1.29 | 1.29 | 1.29 | 1.31 | 1.32 | 1.30 | 1.37 | 1.41 | 1.43 | 1.44 | 1.39 | |||||||||||
Milling Activities | |||||||||||||||||||||||
Ore milled | 000 tonnes | 43,800 | 43,800 | 43,800 | 43,800 | 43,800 | 43,800 | 43,800 | 43,800 | 43,800 | 43,800 | 43,800 | |||||||||||
Headgrade – Cu | % | 0.336% | 0.312% | 0.314% | 0.339% | 0.357% | 0.349% | 0.319% | 0.330% | 0.329% | 0.320% | 0.285% | |||||||||||
Headgrade – Mo | % | 0.008% | 0.003% | 0.004% | 0.004% | 0.003% | 0.006% | 0.008% | 0.008% | 0.008% | 0.009% | 0.004% | |||||||||||
Headgrade – Au | g/tonne | 0.042 | 0.044 | 0.043 | 0.040 | 0.026 | 0.026 | 0.037 | 0.039 | 0.040 | 0.040 | 0.051 | |||||||||||
Headgrade – Ag | g/tonne | 0.904 | 0.916 | 0.751 | 0.733 | 0.639 | 0.572 | 0.854 | 1.008 | 0.867 | 0.846 | 1.028 | |||||||||||
Milling Rate | 000 t/day | 120 | 120 | 120 | 120 | 120 | 120 | 120 | 120 | 120 | 120 | 120 | |||||||||||
Unit cost | $/t milled | 4.90 | 4.90 | 4.90 | 4.90 | 4.90 | 4.90 | 4.90 | 4.90 | 4.90 | 4.90 | 4.90 | |||||||||||
Concentrates Produced & Sold | |||||||||||||||||||||||
Copper concentrate | 000 tonnes | 442 | 410 | 412 | 445 | 469 | 459 | 419 | 433 | 432 | 420 | 374 | |||||||||||
Contained metal – Cu | 000 tonnes | 132 | 123 | 124 | 134 | 141 | 138 | 126 | 130 | 130 | 126 | 112 | |||||||||||
Contained metal – Au | 000 ounces | 35 | 37 | 36 | 34 | 22 | 22 | 31 | 33 | 34 | 34 | 43 | |||||||||||
Contained metal – Ag | 000 ounces | 764 | 774 | 634 | 619 | 540 | 483 | 721 | 852 | 733 | 715 | 869 | |||||||||||
Payable metal - Cu | 000 tonnes | 128 | 119 | 129 | 136 | 133 | 121 | 125 | 125 | 122 | 108 | ||||||||||||
Payable metal – Au | 000 ounces | 32 | 33 | 33 | 30 | 20 | 20 | 28 | 30 | 30 | 31 | 39 | |||||||||||
Payable metal – Ag | 000 ounces | 688 | 696 | 571 | 557 | 486 | 435 | 649 | 767 | 660 | 644 | 782 | |||||||||||
Moly concentrate | 000 tonnes | 3 | 1 | 2 | 2 | 1 | 2 | 4 | 4 | 3 | 4 | 2 | |||||||||||
Contained metal – Mo | 000 tonnes | 2 | 1 | 1 | 1 | 1 | 1 | 2 | 2 | 2 | 2 | 1 | |||||||||||
Payable metal – Mo | 000 tonnes | 2 | 1 | 1 | 1 | 1 | 1 | 2 | 2 | 2 | 2 | 1 | |||||||||||
Capital Costs | |||||||||||||||||||||||
Project capital | $ millions | - | - | - | - | - | - | - | - | - | - | - | |||||||||||
Sustaining capital | $ millions | 29 | 27 | 27 | 25 | 25 | 25 | 25 | 27 | 27 | 10 | 10 | |||||||||||
Deferred stripping | $ millions | 25 | 28 | - | 3 | - | 29 | 30 | - | - | - | - | |||||||||||
Total | $ millions | 54 | 55 | 27 | 28 | 25 | 54 | 55 | 27 | 27 | 10 | 10 | |||||||||||
Operating Costs | |||||||||||||||||||||||
Mining | $ millions | 207 | 206 | 206 | 210 | 211 | 209 | 207 | 155 | 109 | 91 | 64 | |||||||||||
Deferred stripping | $ millions | (25) | (28) | - | (3) | - | (29) | (30) | - | - | - | - | |||||||||||
Milling | $ millions | 215 | 215 | 215 | 215 | 215 | 215 | 215 | 215 | 215 | 215 | 215 | |||||||||||
G&A | $ millions | 55 | 55 | 55 | 55 | 55 | 55 | 55 | 55 | 53 | 53 | 53 | |||||||||||
Closure + surety bonds | $ millions | 1 | 1 | 1 | 1 | 1 | 1 | 1 | 1 | 1 | 1 | 1 | |||||||||||
Total | $ millions | 453 | 448 | 477 | 478 | 481 | 450 | 448 | 426 | 377 | 359 | 332 | |||||||||||
Cost Metrics | |||||||||||||||||||||||
Cash cost | $/lb Cu prod. | 1.63 | 1.77 | 1.87 | 1.77 | 1.78 | 1.67 | 1.70 | 1.56 | 1.41 | 1.35 | 1.38 | |||||||||||
Sustaining cash cost | $/lb Cu prod. | 1.83 | 1.98 | 1.98 | 1.87 | 1.87 | 1.86 | 1.91 | 1.67 | 1.51 | 1.39 | 1.43 | |||||||||||
Combined unit cost | $/t milled | 10.35 | 10.23 | 10.88 | 10.91 | 10.98 | 10.27 | 10.22 | 9.72 | 8.61 | 8.20 | 7.58 | |||||||||||
Cash Flow Summary | |||||||||||||||||||||||
Gross revenue | $ millions | 971 | 889 | 892 | 958 | 982 | 974 | 921 | 955 | 949 | 932 | 832 | |||||||||||
TC/RC | $ millions | (63) | (56) | (57) | (61) | (64) | (64) | (60) | (62) | (61) | (61) | (52) | |||||||||||
Freight | $ millions | (58) | (53) | (54) | (58) | (61) | (60) | (55) | (57) | (56) | (55) | (49) | |||||||||||
NSR royalty | $ millions | (3) | (3) | (3) | (3) | (3) | (3) | (3) | (3) | (3) | (3) | (3) | |||||||||||
Operating costs | $ millions | (453) | (448) | (477) | (478) | (481) | (450) | (448) | (426) | (377) | (359) | (332) | |||||||||||
Federal tax | $ millions | (14) | (21) | (24) | (23) | (29) | (31) | (31) | (27) | (34) | (41) | (43) | |||||||||||
State tax | $ millions | (7) | (11) | (13) | (12) | (15) | (16) | (17) | (15) | (18) | (21) | (21) | |||||||||||
WC changes | $ millions | 2 | 5 | (0) | (4) | (1) | 0 | 3 | (10) | (8) | (5) | 2 | |||||||||||
Cash from operations | $ millions | 374 | 302 | 266 | 318 | 328 | 350 | 310 | 355 | 390 | 388 | 334 | |||||||||||
Capital costs | $ millions | (54) | (55) | (27) | (28) | (25) | (54) | (55) | (27) | (27) | (10) | (10) | |||||||||||
Unlevered free cash flow | $ millions | 321 | 246 | 239 | 289 | 303 | 296 | 255 | 328 | 363 | 378 | 324 | |||||||||||
Mason Cash Flow Model | Unit | Y19 | Y20 | Y21 | Y22 | Y23 | Y24 | Y25 | Y26 | Y27 | Y28 | Y29 | |||||||||||
Mining Activities | |||||||||||||||||||||||
Ore mined | 000 tonnes | 43,800 | 10,498 | - | - | - | - | - | - | - | - | - | |||||||||||
Waste mined | 000 tonnes | 2,031 | 241 | - | - | - | - | - | - | - | - | - | |||||||||||
Rehandle | 000 tonnes | - | 33,302 | 43,800 | 43,800 | 43,800 | 43,800 | 43,800 | 43,800 | 4,939 | - | - | |||||||||||
Pre-strip – Ore mined | 000 tonnes | - | - | - | - | - | - | - | - | - | - | - | |||||||||||
Pre-strip – Waste mined | 000 tonnes | - | - | - | - | - | - | - | - | - | - | - | |||||||||||
Mineral moved | 000 tonnes | 45,831 | 44,041 | 43,800 | 43,800 | 43,800 | 43,800 | 43,800 | 43,800 | 4,939 | - | - | |||||||||||
Strip ratio excl. pre-strip | waste/ore | 0.05 | 0.02 | - | - | - | - | - | - | - | - | - | |||||||||||
Mining rate | 000 t/day | 126 | 29 | - | - | - | - | - | - | - | - | - | |||||||||||
Unit cost | $/t moved | 1.02 | 0.50 | 0.50 | 0.50 | 0.50 | 0.50 | 0.50 | 0.50 | 0.50 | - | - | |||||||||||
Milling Activities | |||||||||||||||||||||||
Ore milled | 000 tonnes | 43,800 | 43,800 | 43,800 | 43,800 | 43,800 | 43,800 | 43,800 | 43,800 | 4,939 | - | - | |||||||||||
Headgrade – Cu | % | 0.282% | 0.245% | 0.217% | 0.202% | 0.190% | 0.177% | 0.161% | 0.141% | 0.117% | - | - | |||||||||||
Headgrade – Mo | % | 0.006% | 0.007% | 0.006% | 0.006% | 0.006% | 0.006% | 0.005% | 0.004% | 0.003% | - | - | |||||||||||
Headgrade – Au | g/tonne | 0.054 | 0.032 | 0.026 | 0.023 | 0.021 | 0.019 | 0.020 | 0.016 | 0.012 | - | - | |||||||||||
Headgrade – Ag | g/tonne | 1.067 | 0.637 | 0.510 | 0.453 | 0.419 | 0.379 | 0.373 | 0.300 | 0.249 | - | - | |||||||||||
Milling Rate | 000 t/day | 120 | 120 | 120 | 120 | 120 | 120 | 120 | 120 | 14 | - | - | |||||||||||
Unit cost | $/t milled | 4.90 | 4.70 | 4.70 | 4.70 | 4.70 | 4.70 | 4.70 | 4.70 | 4.70 | - | - | |||||||||||
Concentrates Produced & Sold | |||||||||||||||||||||||
Copper concentrate | 000 tonnes | 370 | 322 | 285 | 265 | 249 | 232 | 212 | 185 | 17 | - | - | |||||||||||
Contained metal – Cu | 000 tonnes | 111 | 97 | 86 | 80 | 75 | 70 | 64 | 56 | 5 | - | - | |||||||||||
Contained metal – Au | 000 ounces | 46 | 27 | 22 | 19 | 18 | 16 | 17 | 13 | 1 | - | - | |||||||||||
Contained metal – Ag | 000 ounces | 901 | 538 | 431 | 383 | 354 | 321 | 315 | 253 | 24 | - | - | |||||||||||
Payable metal - Cu | 000 tonnes | 107 | 93 | 83 | 77 | 72 | 67 | 61 | 54 | 5 | - | - | |||||||||||
Payable metal – Au | 000 ounces | 41 | 24 | 20 | 17 | 16 | 15 | 15 | 12 | 1 | - | - | |||||||||||
Payable metal – Ag | 000 ounces | 811 | 484 | 387 | 345 | 319 | 288 | 283 | 228 | 21 | - | - | |||||||||||
Moly concentrate | 000 tonnes | 3 | 3 | 3 | 3 | 3 | 3 | 2 | 2 | 0 | - | - | |||||||||||
Contained metal – Mo | 000 tonnes | 1 | 1 | 1 | 1 | 1 | 1 | 1 | 1 | 0 | - | - | |||||||||||
Payable metal – Mo | 000 tonnes | 1 | 1 | 1 | 1 | 1 | 1 | 1 | 1 | 0 | - | - | |||||||||||
Capital Costs | |||||||||||||||||||||||
Project capital | $ millions | - | - | - | - | - | - | - | - | - | - | - | |||||||||||
Sustaining capital | $ millions | 10 | 10 | 10 | 10 | 5 | 5 | 5 | 5 | - | - | - | |||||||||||
Deferred stripping | $ millions | - | - | - | - | - | - | - | - | - | - | - | |||||||||||
Total | $ millions | 10 | 10 | 10 | 10 | 5 | 5 | 5 | 5 | - | - | - | |||||||||||
Operating Costs | |||||||||||||||||||||||
Mining | $ millions | 47 | 22 | 22 | 22 | 22 | 22 | 22 | 22 | 2 | - | - | |||||||||||
Deferred stripping | $ millions | - | - | - | - | - | - | - | - | - | - | - | |||||||||||
Milling | $ millions | 215 | 206 | 206 | 206 | 206 | 206 | 206 | 206 | 23 | - | - | |||||||||||
G&A | $ millions | 44 | 44 | 35 | 35 | 35 | 35 | 35 | 35 | 4 | - | - | |||||||||||
Closure + surety bonds | $ millions | 1 | 1 | 1 | 1 | 1 | 1 | 1 | 1 | 41 | 41 | 40 | |||||||||||
Total | $ millions | 306 | 273 | 264 | 264 | 264 | 264 | 264 | 264 | 71 | 41 | 40 | |||||||||||
Cost Metrics | |||||||||||||||||||||||
Cash cost | $/lb Cu prod. | 1.23 | 1.34 | 1.47 | 1.57 | 1.66 | 1.77 | 1.93 | 2.22 | 2.78 | - | - | |||||||||||
Sustaining cash cost | $/lb Cu prod. | 1.28 | 1.40 | 1.54 | 1.64 | 1.70 | 1.82 | 1.97 | 2.27 | 2.79 | - | - | |||||||||||
Combined unit cost | $/t milled | 6.99 | 6.23 | 6.02 | 6.02 | 6.02 | 6.02 | 6.02 | 6.02 | 6.22 | - | - | |||||||||||
Cash Flow Summary | |||||||||||||||||||||||
Gross revenue | $ millions | 838 | 714 | 629 | 586 | 552 | 515 | 472 | 410 | 38 | - | - | |||||||||||
TC/RC | $ millions | (53) | (46) | (41) | (38) | (36) | (34) | (31) | (27) | (2) | - | - | |||||||||||
Freight | $ millions | (48) | (42) | (37) | (35) | (33) | (30) | (28) | (24) | (2) | - | - | |||||||||||
NSR royalty | $ millions | (3) | (3) | (2) | (2) | (2) | (2) | (2) | (1) | (0) | - | - | |||||||||||
Operating costs | $ millions | (306) | (273) | (264) | (264) | (264) | (264) | (264) | (264) | (71) | (41) | (40) | |||||||||||
Federal tax | $ millions | (37) | (43) | (34) | (26) | (22) | (20) | (17) | (13) | (8) | - | - | |||||||||||
State tax | $ millions | (19) | (20) | (17) | (13) | (12) | (10) | (9) | (7) | (4) | - | - | |||||||||||
WC changes | $ millions | (5) | 3 | 4 | 3 | 1 | 2 | 3 | 4 | (8) | (2) | - | |||||||||||
Cash from operations | $ millions | 367 | 290 | 239 | 210 | 185 | 158 | 125 | 77 | (58) | (43) | (40) | |||||||||||
Capital costs | $ millions | (10) | (10) | (10) | (10) | (5) | (5) | (5) | (5) | - | - | - | |||||||||||
Unlevered free cash flow | $ millions | 357 | 280 | 229 | 200 | 180 | 153 | 120 | 72 | (58) | (43) | (40) | |||||||||||
Model Assumptions
METAL | UNIT | PRICE | |
Copper | $/lb | $3.10 | |
Molybdenum | $/lb | $10.00 | |
Gold | $/oz | $1,500.00 | |
Silver | $/oz | $18.00 | |
METAL | UNIT | RECOVERIES | |
Copper | % | 90.00% | |
Molybdenum | % | 50.00% | |
Gold | % | 60.00% | |
Silver | % | 60.00% | |
METAL | UNIT | CONC. GRADE | |
Copper | % | 30.00% | |
Molybdenum | % | 50.00% | |
METAL | UNIT | PAYABILITY | |
Copper | % | 96.50% | |
Molybdenum | % | 99.00% | |
Gold | % | 90.00% | |
Silver | % | 90.00% | |
Note: a 0.4% net smelter return royalty is payable on minerals extracted from the Mason claims. | |||
MATERIAL | TYPE | UNIT | CHARGE |
Cu concentrate | Treatment | $/dmt | $80.00 |
Payable moly | Roasting | $/lb | $1.20 |
Payable copper | Refining | $/lb | $0.08 |
Payable gold | Refining | $/oz | $5.00 |
Payable silver | Refining | $/oz | $0.50 |
MATERIAL | TYPE | UNIT | VALUE |
Cu concentrate | Moisture | % H2O | 8.00% |
Blended freight | $/wmt | $119.67 | |
Mo concentrate | Moisture | % H2O | 4.00% |
Blended freight | $/wmt | $72.73 | |
Figure 1: Mason Location Map
The Mason project is located in west-central Nevada, approximately 75 kilometres southeast of Reno and seven kilometres west of the town of Yerington. The area is known as the historic Yerington Mining District due to known historical mining activities.
https://www.globenewswire.com/NewsRoom/AttachmentNg/89db298e-d898-4b48-b2b7-1565d3fd4946
Figure 2: Mason Land Package
Through a combination of patented and unpatented mineral claims on public and private land, the Mason project has a total area of approximately 13,820 hectares, including the land acquired through the Mason Valley acquisition in 2019.
https://www.globenewswire.com/NewsRoom/AttachmentNg/dc4575cd-44d2-42fe-ab83-1f44007456c5
Figure 3: Mason Proposed Site Layout
Proposed site layout including the location of the Mason open pit mine, the processing plant, waste rock facility and tailings management facility.
https://www.globenewswire.com/NewsRoom/AttachmentNg/21526cfc-d5dd-4a51-992a-8a61373cfd48
Figure 4: Mason Valley Historical Mines
The Mason Valley property consists of several past-producing mines with visuals of copper mineralization in the area.
https://www.globenewswire.com/NewsRoom/AttachmentNg/81253ee0-79e4-437d-b8a2-d26212189dd1
________________________
i Copper equivalent grade calculated using the following commodity price assumptions: $3.10 per pound copper, $1,500 per ounce gold, $18.00 per ounce silver and $10.00 per pound molybdenum.
