
 Yahoo Finance
 Himax Technologies' (NASDAQ:HIMX) five-year earnings growth trails the strong shareholder returns
The worst result, after buying shares in a company (assuming no leverage), would be if you lose all the money you put in. But on the bright side, you can make far more than 100% on a really good stock. Long term Himax Technologies, Inc. (NASDAQ:HIMX) shareholders would be well aware of this, since the stock is up 171% in five years. Also pleasing for shareholders was the 50% gain in the last three months.
The past week has proven to be lucrative for Himax Technologies investors, so let's see if fundamentals drove the company's five-year performance.
See our latest analysis for Himax Technologies
While markets are a powerful pricing mechanism, share prices reflect investor sentiment, not just underlying business performance. One flawed but reasonable way to assess how sentiment around a company has changed is to compare the earnings per share (EPS) with the share price.
Over half a decade, Himax Technologies managed to grow its earnings per share at 39% a year. This EPS growth is higher than the 22% average annual increase in the share price. So one could conclude that the broader market has become more cautious towards the stock.
The image below shows how EPS has tracked over time (if you click on the image you can see greater detail).
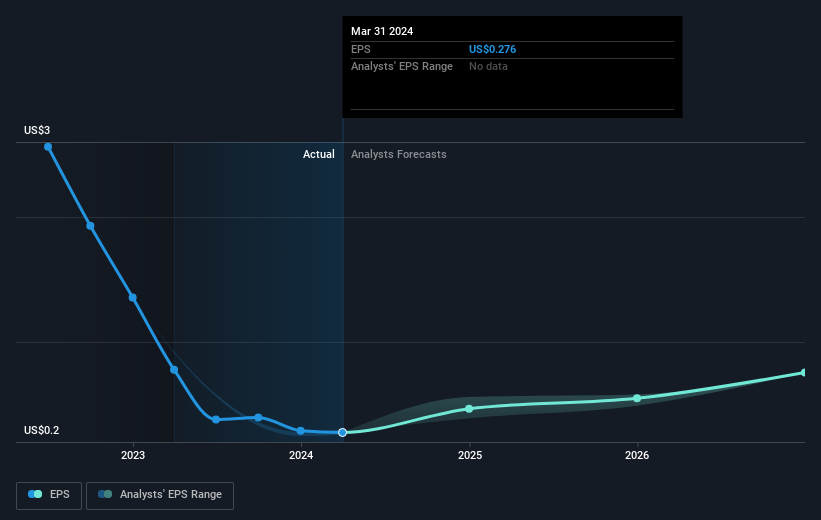
Before buying or selling a stock, we always recommend a close examination of historic growth trends, available here.
What About Dividends?
As well as measuring the share price return, investors should also consider the total shareholder return (TSR). The TSR is a return calculation that accounts for the value of cash dividends (assuming that any dividend received was reinvested) and the calculated value of any discounted capital raisings and spin-offs. So for companies that pay a generous dividend, the TSR is often a lot higher than the share price return. As it happens, Himax Technologies' TSR for the last 5 years was 254%, which exceeds the share price return mentioned earlier. The dividends paid by the company have thusly boosted the total shareholder return.
A Different Perspective
Himax Technologies shareholders are up 13% for the year (even including dividends). But that return falls short of the market. On the bright side, the longer term returns (running at about 29% a year, over half a decade) look better. It may well be that this is a business worth popping on the watching, given the continuing positive reception, over time, from the market. I find it very interesting to look at share price over the long term as a proxy for business performance. But to truly gain insight, we need to consider other information, too. Even so, be aware that Himax Technologies is showing 2 warning signs in our investment analysis , you should know about...
If you would prefer to check out another company -- one with potentially superior financials -- then do not miss this free list of companies that have proven they can grow earnings.
Please note, the market returns quoted in this article reflect the market weighted average returns of stocks that currently trade on American exchanges.
Have feedback on this article? Concerned about the content? Get in touch with us directly. Alternatively, email editorial-team (at) simplywallst.com.
This article by Simply Wall St is general in nature. We provide commentary based on historical data and analyst forecasts only using an unbiased methodology and our articles are not intended to be financial advice. It does not constitute a recommendation to buy or sell any stock, and does not take account of your objectives, or your financial situation. We aim to bring you long-term focused analysis driven by fundamental data. Note that our analysis may not factor in the latest price-sensitive company announcements or qualitative material. Simply Wall St has no position in any stocks mentioned.
Have feedback on this article? Concerned about the content? Get in touch with us directly. Alternatively, email editorial-team@simplywallst.com
