
 Yahoo Finance
 Hershey (NYSE:HSY) Might Be Having Difficulty Using Its Capital Effectively
There are a few key trends to look for if we want to identify the next multi-bagger. Ideally, a business will show two trends; firstly a growing return on capital employed (ROCE) and secondly, an increasing amount of capital employed. Ultimately, this demonstrates that it's a business that is reinvesting profits at increasing rates of return. So when we looked at Hershey (NYSE:HSY), they do have a high ROCE, but we weren't exactly elated from how returns are trending.
What is Return On Capital Employed (ROCE)?
If you haven't worked with ROCE before, it measures the 'return' (pre-tax profit) a company generates from capital employed in its business. Analysts use this formula to calculate it for Hershey:
Return on Capital Employed = Earnings Before Interest and Tax (EBIT) ÷ (Total Assets - Current Liabilities)
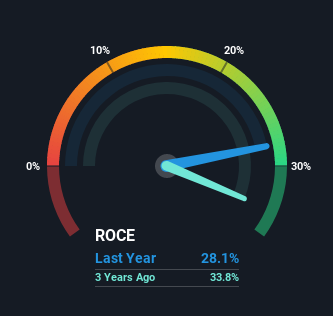
0.28 = US$2.1b ÷ (US$8.9b - US$1.6b) (Based on the trailing twelve months to July 2021).
Thus, Hershey has an ROCE of 28%. In absolute terms that's a great return and it's even better than the Food industry average of 9.9%.
See our latest analysis for Hershey
In the above chart we have measured Hershey's prior ROCE against its prior performance, but the future is arguably more important. If you're interested, you can view the analysts predictions in our free report on analyst forecasts for the company.
What The Trend Of ROCE Can Tell Us
On the surface, the trend of ROCE at Hershey doesn't inspire confidence. Historically returns on capital were even higher at 50%, but they have dropped over the last five years. Meanwhile, the business is utilizing more capital but this hasn't moved the needle much in terms of sales in the past 12 months, so this could reflect longer term investments. It's worth keeping an eye on the company's earnings from here on to see if these investments do end up contributing to the bottom line.
On a side note, Hershey has done well to pay down its current liabilities to 18% of total assets. That could partly explain why the ROCE has dropped. What's more, this can reduce some aspects of risk to the business because now the company's suppliers or short-term creditors are funding less of its operations. Some would claim this reduces the business' efficiency at generating ROCE since it is now funding more of the operations with its own money.
What We Can Learn From Hershey's ROCE
Bringing it all together, while we're somewhat encouraged by Hershey's reinvestment in its own business, we're aware that returns are shrinking. Yet to long term shareholders the stock has gifted them an incredible 108% return in the last five years, so the market appears to be rosy about its future. But if the trajectory of these underlying trends continue, we think the likelihood of it being a multi-bagger from here isn't high.
On a separate note, we've found 1 warning sign for Hershey you'll probably want to know about.
Hershey is not the only stock earning high returns. If you'd like to see more, check out our free list of companies earning high returns on equity with solid fundamentals.
This article by Simply Wall St is general in nature. We provide commentary based on historical data and analyst forecasts only using an unbiased methodology and our articles are not intended to be financial advice. It does not constitute a recommendation to buy or sell any stock, and does not take account of your objectives, or your financial situation. We aim to bring you long-term focused analysis driven by fundamental data. Note that our analysis may not factor in the latest price-sensitive company announcements or qualitative material. Simply Wall St has no position in any stocks mentioned.
Have feedback on this article? Concerned about the content? Get in touch with us directly. Alternatively, email editorial-team (at) simplywallst.com.
