
 Yahoo Finance
 Heritage Insurance Holdings, Inc.'s (NYSE:HRTG) Stock On An Uptrend: Could Fundamentals Be Driving The Momentum?
Most readers would already be aware that Heritage Insurance Holdings' (NYSE:HRTG) stock increased significantly by 52% over the past three months. As most would know, fundamentals are what usually guide market price movements over the long-term, so we decided to look at the company's key financial indicators today to determine if they have any role to play in the recent price movement. Particularly, we will be paying attention to Heritage Insurance Holdings' ROE today.
Return on equity or ROE is an important factor to be considered by a shareholder because it tells them how effectively their capital is being reinvested. Simply put, it is used to assess the profitability of a company in relation to its equity capital.
Check out our latest analysis for Heritage Insurance Holdings
How Do You Calculate Return On Equity?
ROE can be calculated by using the formula:
Return on Equity = Net Profit (from continuing operations) ÷ Shareholders' Equity
So, based on the above formula, the ROE for Heritage Insurance Holdings is:
21% = US$45m ÷ US$220m (Based on the trailing twelve months to December 2023).
The 'return' is the profit over the last twelve months. One way to conceptualize this is that for each $1 of shareholders' capital it has, the company made $0.21 in profit.
What Is The Relationship Between ROE And Earnings Growth?
We have already established that ROE serves as an efficient profit-generating gauge for a company's future earnings. Depending on how much of these profits the company reinvests or "retains", and how effectively it does so, we are then able to assess a company’s earnings growth potential. Assuming everything else remains unchanged, the higher the ROE and profit retention, the higher the growth rate of a company compared to companies that don't necessarily bear these characteristics.
A Side By Side comparison of Heritage Insurance Holdings' Earnings Growth And 21% ROE
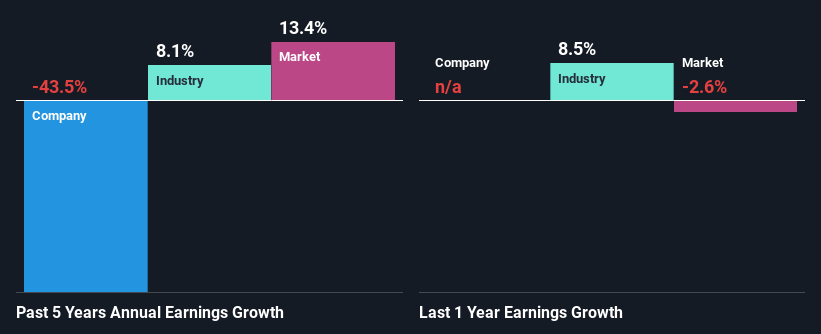
To begin with, Heritage Insurance Holdings seems to have a respectable ROE. On comparing with the average industry ROE of 13% the company's ROE looks pretty remarkable. As you might expect, the 43% net income decline reported by Heritage Insurance Holdings is a bit of a surprise. Based on this, we feel that there might be other reasons which haven't been discussed so far in this article that could be hampering the company's growth. For example, it could be that the company has a high payout ratio or the business has allocated capital poorly, for instance.
That being said, we compared Heritage Insurance Holdings' performance with the industry and were concerned when we found that while the company has shrunk its earnings, the industry has grown its earnings at a rate of 8.1% in the same 5-year period.
Earnings growth is a huge factor in stock valuation. What investors need to determine next is if the expected earnings growth, or the lack of it, is already built into the share price. This then helps them determine if the stock is placed for a bright or bleak future. If you're wondering about Heritage Insurance Holdings''s valuation, check out this gauge of its price-to-earnings ratio, as compared to its industry.
Is Heritage Insurance Holdings Making Efficient Use Of Its Profits?
Because Heritage Insurance Holdings doesn't pay any regular dividends, we infer that it is retaining all of its profits, which is rather perplexing when you consider the fact that there is no earnings growth to show for it. So there could be some other explanations in that regard. For instance, the company's business may be deteriorating.
Conclusion
On the whole, we do feel that Heritage Insurance Holdings has some positive attributes. Yet, the low earnings growth is a bit concerning, especially given that the company has a high rate of return and is reinvesting ma huge portion of its profits. By the looks of it, there could be some other factors, not necessarily in control of the business, that's preventing growth. Having said that, looking at current analyst estimates, we found that the company's earnings growth rate is expected to see a huge improvement. To know more about the latest analysts predictions for the company, check out this visualization of analyst forecasts for the company.
Have feedback on this article? Concerned about the content? Get in touch with us directly. Alternatively, email editorial-team (at) simplywallst.com.
This article by Simply Wall St is general in nature. We provide commentary based on historical data and analyst forecasts only using an unbiased methodology and our articles are not intended to be financial advice. It does not constitute a recommendation to buy or sell any stock, and does not take account of your objectives, or your financial situation. We aim to bring you long-term focused analysis driven by fundamental data. Note that our analysis may not factor in the latest price-sensitive company announcements or qualitative material. Simply Wall St has no position in any stocks mentioned.
