
 Yahoo Finance
 Here's Why We're Not Too Worried About C3 Metals' (CVE:CCCM) Cash Burn Situation
Just because a business does not make any money, does not mean that the stock will go down. For example, although Amazon.com made losses for many years after listing, if you had bought and held the shares since 1999, you would have made a fortune. Having said that, unprofitable companies are risky because they could potentially burn through all their cash and become distressed.
Given this risk, we thought we'd take a look at whether C3 Metals (CVE:CCCM) shareholders should be worried about its cash burn. For the purposes of this article, cash burn is the annual rate at which an unprofitable company spends cash to fund its growth; its negative free cash flow. First, we'll determine its cash runway by comparing its cash burn with its cash reserves.
See our latest analysis for C3 Metals
How Long Is C3 Metals' Cash Runway?
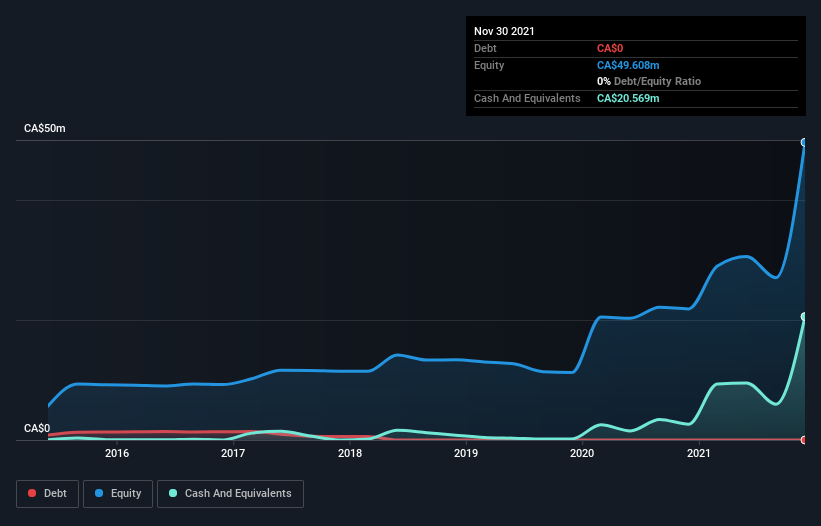
You can calculate a company's cash runway by dividing the amount of cash it has by the rate at which it is spending that cash. In November 2021, C3 Metals had CA$21m in cash, and was debt-free. Looking at the last year, the company burnt through CA$4.3m. That means it had a cash runway of about 4.8 years as of November 2021. There's no doubt that this is a reassuringly long runway. You can see how its cash balance has changed over time in the image below.
How Is C3 Metals' Cash Burn Changing Over Time?
Because C3 Metals isn't currently generating revenue, we consider it an early-stage business. So while we can't look to sales to understand growth, we can look at how the cash burn is changing to understand how expenditure is trending over time. Over the last year its cash burn actually increased by a very significant 85%. While this spending increase is no doubt intended to drive growth, if the trend continues the company's cash runway will shrink very quickly. While the past is always worth studying, it is the future that matters most of all. So you might want to take a peek at how much the company is expected to grow in the next few years.
How Hard Would It Be For C3 Metals To Raise More Cash For Growth?
While C3 Metals does have a solid cash runway, its cash burn trajectory may have some shareholders thinking ahead to when the company may need to raise more cash. Generally speaking, a listed business can raise new cash through issuing shares or taking on debt. Commonly, a business will sell new shares in itself to raise cash and drive growth. By looking at a company's cash burn relative to its market capitalisation, we gain insight on how much shareholders would be diluted if the company needed to raise enough cash to cover another year's cash burn.
C3 Metals has a market capitalisation of CA$50m and burnt through CA$4.3m last year, which is 8.6% of the company's market value. Given that is a rather small percentage, it would probably be really easy for the company to fund another year's growth by issuing some new shares to investors, or even by taking out a loan.
Is C3 Metals' Cash Burn A Worry?
As you can probably tell by now, we're not too worried about C3 Metals' cash burn. For example, we think its cash runway suggests that the company is on a good path. While we must concede that its increasing cash burn is a bit worrying, the other factors mentioned in this article provide great comfort when it comes to the cash burn. After taking into account the various metrics mentioned in this report, we're pretty comfortable with how the company is spending its cash, as it seems on track to meet its needs over the medium term. On another note, C3 Metals has 5 warning signs (and 1 which is potentially serious) we think you should know about.
If you would prefer to check out another company with better fundamentals, then do not miss this free list of interesting companies, that have HIGH return on equity and low debt or this list of stocks which are all forecast to grow.
Have feedback on this article? Concerned about the content? Get in touch with us directly. Alternatively, email editorial-team (at) simplywallst.com.
This article by Simply Wall St is general in nature. We provide commentary based on historical data and analyst forecasts only using an unbiased methodology and our articles are not intended to be financial advice. It does not constitute a recommendation to buy or sell any stock, and does not take account of your objectives, or your financial situation. We aim to bring you long-term focused analysis driven by fundamental data. Note that our analysis may not factor in the latest price-sensitive company announcements or qualitative material. Simply Wall St has no position in any stocks mentioned.
