
 Yahoo Finance
 Here's Why Diamondback Energy (NASDAQ:FANG) Has A Meaningful Debt Burden
David Iben put it well when he said, 'Volatility is not a risk we care about. What we care about is avoiding the permanent loss of capital.' It's only natural to consider a company's balance sheet when you examine how risky it is, since debt is often involved when a business collapses. As with many other companies Diamondback Energy, Inc. (NASDAQ:FANG) makes use of debt. But the more important question is: how much risk is that debt creating?
When Is Debt Dangerous?
Debt is a tool to help businesses grow, but if a business is incapable of paying off its lenders, then it exists at their mercy. Ultimately, if the company can't fulfill its legal obligations to repay debt, shareholders could walk away with nothing. However, a more usual (but still expensive) situation is where a company must dilute shareholders at a cheap share price simply to get debt under control. Of course, plenty of companies use debt to fund growth, without any negative consequences. The first step when considering a company's debt levels is to consider its cash and debt together.
View our latest analysis for Diamondback Energy
What Is Diamondback Energy's Debt?
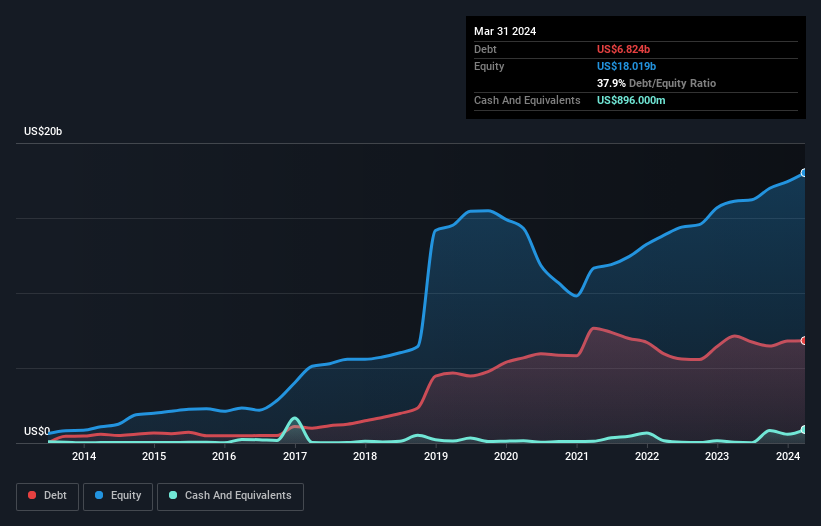
You can click the graphic below for the historical numbers, but it shows that Diamondback Energy had US$6.82b of debt in March 2024, down from US$7.14b, one year before. However, it also had US$896.0m in cash, and so its net debt is US$5.93b.
A Look At Diamondback Energy's Liabilities
According to the last reported balance sheet, Diamondback Energy had liabilities of US$2.12b due within 12 months, and liabilities of US$9.55b due beyond 12 months. On the other hand, it had cash of US$896.0m and US$942.0m worth of receivables due within a year. So it has liabilities totalling US$9.83b more than its cash and near-term receivables, combined.
This deficit isn't so bad because Diamondback Energy is worth a massive US$34.0b, and thus could probably raise enough capital to shore up its balance sheet, if the need arose. But we definitely want to keep our eyes open to indications that its debt is bringing too much risk.
We use two main ratios to inform us about debt levels relative to earnings. The first is net debt divided by earnings before interest, tax, depreciation, and amortization (EBITDA), while the second is how many times its earnings before interest and tax (EBIT) covers its interest expense (or its interest cover, for short). Thus we consider debt relative to earnings both with and without depreciation and amortization expenses.
Diamondback Energy's net debt is only 0.93 times its EBITDA. And its EBIT covers its interest expense a whopping 18.7 times over. So you could argue it is no more threatened by its debt than an elephant is by a mouse. In fact Diamondback Energy's saving grace is its low debt levels, because its EBIT has tanked 22% in the last twelve months. When it comes to paying off debt, falling earnings are no more useful than sugary sodas are for your health. There's no doubt that we learn most about debt from the balance sheet. But it is future earnings, more than anything, that will determine Diamondback Energy's ability to maintain a healthy balance sheet going forward. So if you're focused on the future you can check out this free report showing analyst profit forecasts.
Finally, a business needs free cash flow to pay off debt; accounting profits just don't cut it. So it's worth checking how much of that EBIT is backed by free cash flow. Looking at the most recent three years, Diamondback Energy recorded free cash flow of 43% of its EBIT, which is weaker than we'd expect. That's not great, when it comes to paying down debt.
Our View
Neither Diamondback Energy's ability to grow its EBIT nor its conversion of EBIT to free cash flow gave us confidence in its ability to take on more debt. But its interest cover tells a very different story, and suggests some resilience. We think that Diamondback Energy's debt does make it a bit risky, after considering the aforementioned data points together. Not all risk is bad, as it can boost share price returns if it pays off, but this debt risk is worth keeping in mind. There's no doubt that we learn most about debt from the balance sheet. However, not all investment risk resides within the balance sheet - far from it. For example, we've discovered 2 warning signs for Diamondback Energy that you should be aware of before investing here.
If you're interested in investing in businesses that can grow profits without the burden of debt, then check out this free list of growing businesses that have net cash on the balance sheet.
Have feedback on this article? Concerned about the content? Get in touch with us directly. Alternatively, email editorial-team (at) simplywallst.com.
This article by Simply Wall St is general in nature. We provide commentary based on historical data and analyst forecasts only using an unbiased methodology and our articles are not intended to be financial advice. It does not constitute a recommendation to buy or sell any stock, and does not take account of your objectives, or your financial situation. We aim to bring you long-term focused analysis driven by fundamental data. Note that our analysis may not factor in the latest price-sensitive company announcements or qualitative material. Simply Wall St has no position in any stocks mentioned.
