
 Yahoo Finance
 Here's Why Calfrac Well Services (TSE:CFW) Is Weighed Down By Its Debt Load

Warren Buffett famously said, 'Volatility is far from synonymous with risk.' When we think about how risky a company is, we always like to look at its use of debt, since debt overload can lead to ruin. Importantly, Calfrac Well Services Ltd. (TSE:CFW) does carry debt. But should shareholders be worried about its use of debt?
When Is Debt A Problem?
Debt is a tool to help businesses grow, but if a business is incapable of paying off its lenders, then it exists at their mercy. Ultimately, if the company can't fulfill its legal obligations to repay debt, shareholders could walk away with nothing. However, a more common (but still painful) scenario is that it has to raise new equity capital at a low price, thus permanently diluting shareholders. Having said that, the most common situation is where a company manages its debt reasonably well - and to its own advantage. The first step when considering a company's debt levels is to consider its cash and debt together.
View our latest analysis for Calfrac Well Services
What Is Calfrac Well Services's Debt?
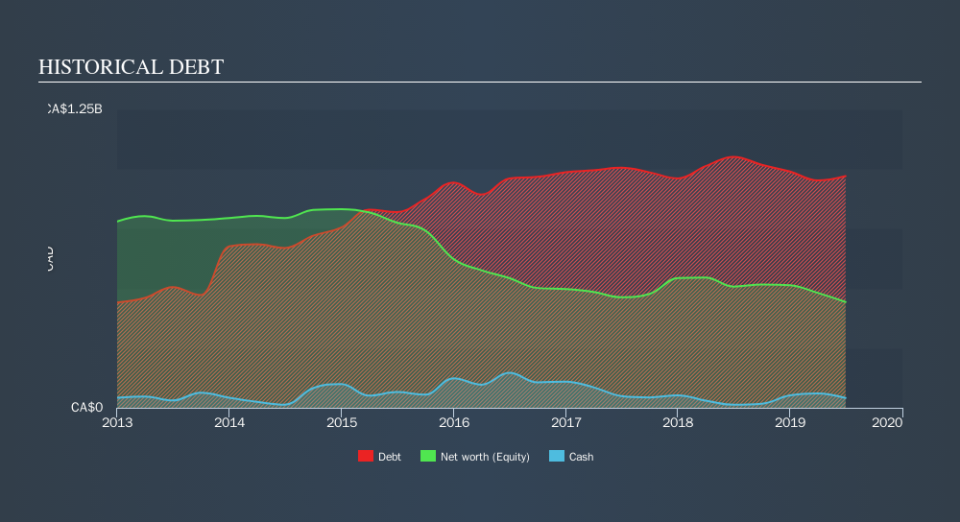
The image below, which you can click on for greater detail, shows that Calfrac Well Services had debt of CA$970.9m at the end of June 2019, a reduction from CA$1.05b over a year. However, because it has a cash reserve of CA$41.2m, its net debt is less, at about CA$929.7m.
A Look At Calfrac Well Services's Liabilities
According to the last reported balance sheet, Calfrac Well Services had liabilities of CA$203.9m due within 12 months, and liabilities of CA$1.02b due beyond 12 months. Offsetting these obligations, it had cash of CA$41.2m as well as receivables valued at CA$289.2m due within 12 months. So its liabilities outweigh the sum of its cash and (near-term) receivables by CA$891.0m.
The deficiency here weighs heavily on the CA$183.7m company itself, as if a child were struggling under the weight of an enormous back-pack full of books, his sports gear, and a trumpet." So we definitely think shareholders need to watch this one closely. After all, Calfrac Well Services would likely require a major re-capitalisation if it had to pay its creditors today.
We measure a company's debt load relative to its earnings power by looking at its net debt divided by its earnings before interest, tax, depreciation, and amortization (EBITDA) and by calculating how easily its earnings before interest and tax (EBIT) cover its interest expense (interest cover). Thus we consider debt relative to earnings both with and without depreciation and amortization expenses.
While we wouldn't worry about Calfrac Well Services's net debt to EBITDA ratio of 3.8, we think its super-low interest cover of 0.62 times is a sign of high leverage. In large part that's due to the company's significant depreciation and amortisation charges, which arguably mean its EBITDA is a very generous measure of earnings, and its debt may be more of a burden than it first appears. So shareholders should probably be aware that interest expenses appear to have really impacted the business lately. Even worse, Calfrac Well Services saw its EBIT tank 31% over the last 12 months. If earnings continue to follow that trajectory, paying off that debt load will be harder than convincing us to run a marathon in the rain. When analysing debt levels, the balance sheet is the obvious place to start. But ultimately the future profitability of the business will decide if Calfrac Well Services can strengthen its balance sheet over time. So if you're focused on the future you can check out this free report showing analyst profit forecasts.
Finally, a business needs free cash flow to pay off debt; accounting profits just don't cut it. So we clearly need to look at whether that EBIT is leading to corresponding free cash flow. In the last two years, Calfrac Well Services created free cash flow amounting to 11% of its EBIT, an uninspiring performance. For us, cash conversion that low sparks a little paranoia about is ability to extinguish debt.
Our View
To be frank both Calfrac Well Services's EBIT growth rate and its track record of staying on top of its total liabilities make us rather uncomfortable with its debt levels. And even its conversion of EBIT to free cash flow fails to inspire much confidence. Considering all the factors previously mentioned, we think that Calfrac Well Services really is carrying too much debt. To our minds, that means the stock is rather high risk, and probably one to avoid; but to each their own (investing) style. Given our concerns about Calfrac Well Services's debt levels, it seems only prudent to check if insiders have been ditching the stock.
When all is said and done, sometimes its easier to focus on companies that don't even need debt. Readers can access a list of growth stocks with zero net debt 100% free, right now.
We aim to bring you long-term focused research analysis driven by fundamental data. Note that our analysis may not factor in the latest price-sensitive company announcements or qualitative material.
If you spot an error that warrants correction, please contact the editor at editorial-team@simplywallst.com. This article by Simply Wall St is general in nature. It does not constitute a recommendation to buy or sell any stock, and does not take account of your objectives, or your financial situation. Simply Wall St has no position in the stocks mentioned. Thank you for reading.
