
 Yahoo Finance
 Here's What's Concerning About Strategic Minerals' (LON:SML) Returns On Capital
Did you know there are some financial metrics that can provide clues of a potential multi-bagger? Firstly, we'll want to see a proven return on capital employed (ROCE) that is increasing, and secondly, an expanding base of capital employed. If you see this, it typically means it's a company with a great business model and plenty of profitable reinvestment opportunities. However, after investigating Strategic Minerals (LON:SML), we don't think it's current trends fit the mold of a multi-bagger.
Understanding Return On Capital Employed (ROCE)
For those who don't know, ROCE is a measure of a company's yearly pre-tax profit (its return), relative to the capital employed in the business. To calculate this metric for Strategic Minerals, this is the formula:
Return on Capital Employed = Earnings Before Interest and Tax (EBIT) ÷ (Total Assets - Current Liabilities)
0.027 = US$390k ÷ (US$15m - US$909k) (Based on the trailing twelve months to December 2022).
Therefore, Strategic Minerals has an ROCE of 2.7%. In absolute terms, that's a low return and it also under-performs the Metals and Mining industry average of 10%.
View our latest analysis for Strategic Minerals
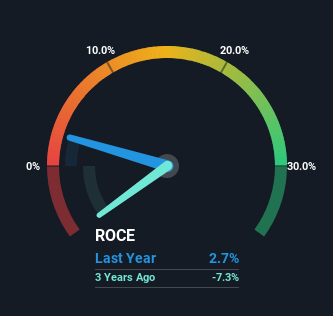
Historical performance is a great place to start when researching a stock so above you can see the gauge for Strategic Minerals' ROCE against it's prior returns. If you want to delve into the historical earnings, revenue and cash flow of Strategic Minerals, check out these free graphs here.
So How Is Strategic Minerals' ROCE Trending?
In terms of Strategic Minerals' historical ROCE movements, the trend isn't fantastic. To be more specific, ROCE has fallen from 34% over the last five years. Meanwhile, the business is utilizing more capital but this hasn't moved the needle much in terms of sales in the past 12 months, so this could reflect longer term investments. It may take some time before the company starts to see any change in earnings from these investments.
The Bottom Line On Strategic Minerals' ROCE
To conclude, we've found that Strategic Minerals is reinvesting in the business, but returns have been falling. Moreover, since the stock has crumbled 88% over the last five years, it appears investors are expecting the worst. All in all, the inherent trends aren't typical of multi-baggers, so if that's what you're after, we think you might have more luck elsewhere.
If you'd like to know more about Strategic Minerals, we've spotted 4 warning signs, and 2 of them are a bit unpleasant.
For those who like to invest in solid companies, check out this free list of companies with solid balance sheets and high returns on equity.
Have feedback on this article? Concerned about the content? Get in touch with us directly. Alternatively, email editorial-team (at) simplywallst.com.
This article by Simply Wall St is general in nature. We provide commentary based on historical data and analyst forecasts only using an unbiased methodology and our articles are not intended to be financial advice. It does not constitute a recommendation to buy or sell any stock, and does not take account of your objectives, or your financial situation. We aim to bring you long-term focused analysis driven by fundamental data. Note that our analysis may not factor in the latest price-sensitive company announcements or qualitative material. Simply Wall St has no position in any stocks mentioned.
