
 Yahoo Finance
 Here's What's Concerning About Newmont's (NYSE:NEM) Returns On Capital
To find a multi-bagger stock, what are the underlying trends we should look for in a business? Amongst other things, we'll want to see two things; firstly, a growing return on capital employed (ROCE) and secondly, an expansion in the company's amount of capital employed. Basically this means that a company has profitable initiatives that it can continue to reinvest in, which is a trait of a compounding machine. However, after investigating Newmont (NYSE:NEM), we don't think it's current trends fit the mold of a multi-bagger.
Understanding Return On Capital Employed (ROCE)
For those who don't know, ROCE is a measure of a company's yearly pre-tax profit (its return), relative to the capital employed in the business. To calculate this metric for Newmont, this is the formula:
Return on Capital Employed = Earnings Before Interest and Tax (EBIT) ÷ (Total Assets - Current Liabilities)
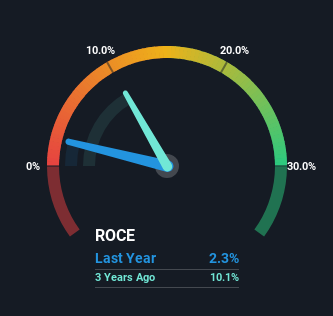
0.023 = US$1.2b ÷ (US$55b - US$5.5b) (Based on the trailing twelve months to March 2024).
Thus, Newmont has an ROCE of 2.3%. Ultimately, that's a low return and it under-performs the Metals and Mining industry average of 9.1%.
View our latest analysis for Newmont
Above you can see how the current ROCE for Newmont compares to its prior returns on capital, but there's only so much you can tell from the past. If you'd like to see what analysts are forecasting going forward, you should check out our free analyst report for Newmont .
How Are Returns Trending?
In terms of Newmont's historical ROCE movements, the trend isn't fantastic. Around five years ago the returns on capital were 6.2%, but since then they've fallen to 2.3%. Although, given both revenue and the amount of assets employed in the business have increased, it could suggest the company is investing in growth, and the extra capital has led to a short-term reduction in ROCE. And if the increased capital generates additional returns, the business, and thus shareholders, will benefit in the long run.
In Conclusion...
While returns have fallen for Newmont in recent times, we're encouraged to see that sales are growing and that the business is reinvesting in its operations. And the stock has followed suit returning a meaningful 62% to shareholders over the last five years. So while the underlying trends could already be accounted for by investors, we still think this stock is worth looking into further.
If you'd like to know more about Newmont, we've spotted 2 warning signs, and 1 of them is a bit concerning.
While Newmont may not currently earn the highest returns, we've compiled a list of companies that currently earn more than 25% return on equity. Check out this free list here.
Have feedback on this article? Concerned about the content? Get in touch with us directly. Alternatively, email editorial-team (at) simplywallst.com.
This article by Simply Wall St is general in nature. We provide commentary based on historical data and analyst forecasts only using an unbiased methodology and our articles are not intended to be financial advice. It does not constitute a recommendation to buy or sell any stock, and does not take account of your objectives, or your financial situation. We aim to bring you long-term focused analysis driven by fundamental data. Note that our analysis may not factor in the latest price-sensitive company announcements or qualitative material. Simply Wall St has no position in any stocks mentioned.
