
 Yahoo Finance
 Here's What's Concerning About EnBW Energie Baden-Württemberg's (ETR:EBK) Returns On Capital
There are a few key trends to look for if we want to identify the next multi-bagger. Firstly, we'll want to see a proven return on capital employed (ROCE) that is increasing, and secondly, an expanding base of capital employed. Put simply, these types of businesses are compounding machines, meaning they are continually reinvesting their earnings at ever-higher rates of return. However, after briefly looking over the numbers, we don't think EnBW Energie Baden-Württemberg (ETR:EBK) has the makings of a multi-bagger going forward, but let's have a look at why that may be.
Return On Capital Employed (ROCE): What Is It?
Just to clarify if you're unsure, ROCE is a metric for evaluating how much pre-tax income (in percentage terms) a company earns on the capital invested in its business. The formula for this calculation on EnBW Energie Baden-Württemberg is:
Return on Capital Employed = Earnings Before Interest and Tax (EBIT) ÷ (Total Assets - Current Liabilities)
0.034 = €1.4b ÷ (€70b - €29b) (Based on the trailing twelve months to December 2022).
So, EnBW Energie Baden-Württemberg has an ROCE of 3.4%. Ultimately, that's a low return and it under-performs the Electric Utilities industry average of 8.5%.
Check out our latest analysis for EnBW Energie Baden-Württemberg
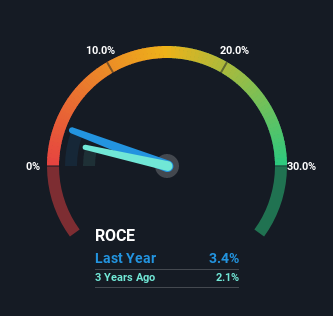
Historical performance is a great place to start when researching a stock so above you can see the gauge for EnBW Energie Baden-Württemberg's ROCE against it's prior returns. If you'd like to look at how EnBW Energie Baden-Württemberg has performed in the past in other metrics, you can view this free graph of past earnings, revenue and cash flow.
What Can We Tell From EnBW Energie Baden-Württemberg's ROCE Trend?
On the surface, the trend of ROCE at EnBW Energie Baden-Württemberg doesn't inspire confidence. Around five years ago the returns on capital were 7.6%, but since then they've fallen to 3.4%. Although, given both revenue and the amount of assets employed in the business have increased, it could suggest the company is investing in growth, and the extra capital has led to a short-term reduction in ROCE. If these investments prove successful, this can bode very well for long term stock performance.
While on the subject, we noticed that the ratio of current liabilities to total assets has risen to 41%, which has impacted the ROCE. Without this increase, it's likely that ROCE would be even lower than 3.4%. And with current liabilities at these levels, suppliers or short-term creditors are effectively funding a large part of the business, which can introduce some risks.
In Conclusion...
In summary, despite lower returns in the short term, we're encouraged to see that EnBW Energie Baden-Württemberg is reinvesting for growth and has higher sales as a result. And the stock has done incredibly well with a 261% return over the last five years, so long term investors are no doubt ecstatic with that result. So should these growth trends continue, we'd be optimistic on the stock going forward.
One final note, you should learn about the 3 warning signs we've spotted with EnBW Energie Baden-Württemberg (including 2 which shouldn't be ignored) .
If you want to search for solid companies with great earnings, check out this free list of companies with good balance sheets and impressive returns on equity.
Have feedback on this article? Concerned about the content? Get in touch with us directly. Alternatively, email editorial-team (at) simplywallst.com.
This article by Simply Wall St is general in nature. We provide commentary based on historical data and analyst forecasts only using an unbiased methodology and our articles are not intended to be financial advice. It does not constitute a recommendation to buy or sell any stock, and does not take account of your objectives, or your financial situation. We aim to bring you long-term focused analysis driven by fundamental data. Note that our analysis may not factor in the latest price-sensitive company announcements or qualitative material. Simply Wall St has no position in any stocks mentioned.
Join A Paid User Research Session
You’ll receive a US$30 Amazon Gift card for 1 hour of your time while helping us build better investing tools for the individual investors like yourself. Sign up here
