
 Yahoo Finance
 Here's What's Concerning About Bentley Systems' (NASDAQ:BSY) Returns On Capital
If you're looking for a multi-bagger, there's a few things to keep an eye out for. Typically, we'll want to notice a trend of growing return on capital employed (ROCE) and alongside that, an expanding base of capital employed. Basically this means that a company has profitable initiatives that it can continue to reinvest in, which is a trait of a compounding machine. Having said that, from a first glance at Bentley Systems (NASDAQ:BSY) we aren't jumping out of our chairs at how returns are trending, but let's have a deeper look.
Return On Capital Employed (ROCE): What Is It?
For those who don't know, ROCE is a measure of a company's yearly pre-tax profit (its return), relative to the capital employed in the business. Analysts use this formula to calculate it for Bentley Systems:
Return on Capital Employed = Earnings Before Interest and Tax (EBIT) ÷ (Total Assets - Current Liabilities)
0.057 = US$141m ÷ (US$3.0b - US$569m) (Based on the trailing twelve months to September 2022).
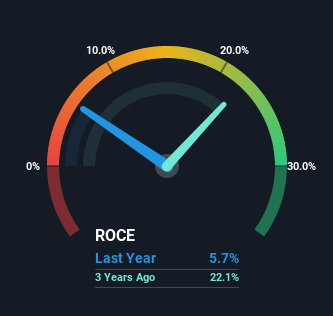
So, Bentley Systems has an ROCE of 5.7%. Ultimately, that's a low return and it under-performs the Software industry average of 10.0%.
View our latest analysis for Bentley Systems
In the above chart we have measured Bentley Systems' prior ROCE against its prior performance, but the future is arguably more important. If you're interested, you can view the analysts predictions in our free report on analyst forecasts for the company.
What Does the ROCE Trend For Bentley Systems Tell Us?
In terms of Bentley Systems' historical ROCE movements, the trend isn't fantastic. Around three years ago the returns on capital were 22%, but since then they've fallen to 5.7%. Although, given both revenue and the amount of assets employed in the business have increased, it could suggest the company is investing in growth, and the extra capital has led to a short-term reduction in ROCE. And if the increased capital generates additional returns, the business, and thus shareholders, will benefit in the long run.
On a related note, Bentley Systems has decreased its current liabilities to 19% of total assets. So we could link some of this to the decrease in ROCE. Effectively this means their suppliers or short-term creditors are funding less of the business, which reduces some elements of risk. Some would claim this reduces the business' efficiency at generating ROCE since it is now funding more of the operations with its own money.
The Bottom Line
In summary, despite lower returns in the short term, we're encouraged to see that Bentley Systems is reinvesting for growth and has higher sales as a result. These trends are starting to be recognized by investors since the stock has delivered a 3.3% gain to shareholders who've held over the last year. So this stock may still be an appealing investment opportunity, if other fundamentals prove to be sound.
Bentley Systems does have some risks, we noticed 3 warning signs (and 1 which is concerning) we think you should know about.
While Bentley Systems isn't earning the highest return, check out this free list of companies that are earning high returns on equity with solid balance sheets.
Have feedback on this article? Concerned about the content? Get in touch with us directly. Alternatively, email editorial-team (at) simplywallst.com.
This article by Simply Wall St is general in nature. We provide commentary based on historical data and analyst forecasts only using an unbiased methodology and our articles are not intended to be financial advice. It does not constitute a recommendation to buy or sell any stock, and does not take account of your objectives, or your financial situation. We aim to bring you long-term focused analysis driven by fundamental data. Note that our analysis may not factor in the latest price-sensitive company announcements or qualitative material. Simply Wall St has no position in any stocks mentioned.
Join A Paid User Research Session
You’ll receive a US$30 Amazon Gift card for 1 hour of your time while helping us build better investing tools for the individual investors like yourself. Sign up here
