
 Yahoo Finance
 Here's What To Make Of Turners Automotive Group's (NZSE:TRA) Decelerating Rates Of Return
If we want to find a stock that could multiply over the long term, what are the underlying trends we should look for? One common approach is to try and find a company with returns on capital employed (ROCE) that are increasing, in conjunction with a growing amount of capital employed. Ultimately, this demonstrates that it's a business that is reinvesting profits at increasing rates of return. Having said that, from a first glance at Turners Automotive Group (NZSE:TRA) we aren't jumping out of our chairs at how returns are trending, but let's have a deeper look.
What Is Return On Capital Employed (ROCE)?
For those who don't know, ROCE is a measure of a company's yearly pre-tax profit (its return), relative to the capital employed in the business. The formula for this calculation on Turners Automotive Group is:
Return on Capital Employed = Earnings Before Interest and Tax (EBIT) ÷ (Total Assets - Current Liabilities)
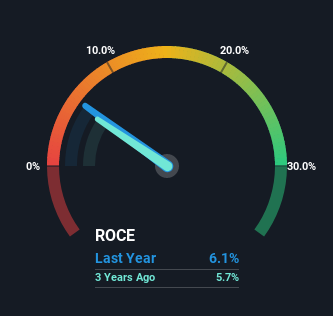
0.061 = NZ$47m ÷ (NZ$826m - NZ$44m) (Based on the trailing twelve months to March 2022).
Therefore, Turners Automotive Group has an ROCE of 6.1%. In absolute terms, that's a low return and it also under-performs the Specialty Retail industry average of 16%.
View our latest analysis for Turners Automotive Group
In the above chart we have measured Turners Automotive Group's prior ROCE against its prior performance, but the future is arguably more important. If you're interested, you can view the analysts predictions in our free report on analyst forecasts for the company.
What The Trend Of ROCE Can Tell Us
The returns on capital haven't changed much for Turners Automotive Group in recent years. Over the past five years, ROCE has remained relatively flat at around 6.1% and the business has deployed 61% more capital into its operations. This poor ROCE doesn't inspire confidence right now, and with the increase in capital employed, it's evident that the business isn't deploying the funds into high return investments.
The Key Takeaway
Long story short, while Turners Automotive Group has been reinvesting its capital, the returns that it's generating haven't increased. Since the stock has gained an impressive 52% over the last five years, investors must think there's better things to come. However, unless these underlying trends turn more positive, we wouldn't get our hopes up too high.
If you'd like to know more about Turners Automotive Group, we've spotted 2 warning signs, and 1 of them is significant.
While Turners Automotive Group isn't earning the highest return, check out this free list of companies that are earning high returns on equity with solid balance sheets.
Have feedback on this article? Concerned about the content? Get in touch with us directly. Alternatively, email editorial-team (at) simplywallst.com.
This article by Simply Wall St is general in nature. We provide commentary based on historical data and analyst forecasts only using an unbiased methodology and our articles are not intended to be financial advice. It does not constitute a recommendation to buy or sell any stock, and does not take account of your objectives, or your financial situation. We aim to bring you long-term focused analysis driven by fundamental data. Note that our analysis may not factor in the latest price-sensitive company announcements or qualitative material. Simply Wall St has no position in any stocks mentioned.
Join A Paid User Research Session
You’ll receive a US$30 Amazon Gift card for 1 hour of your time while helping us build better investing tools for the individual investors like yourself. Sign up here
