
 Yahoo Finance
 Here's What Safety Insurance Group, Inc.'s (NASDAQ:SAFT) P/E Ratio Is Telling Us

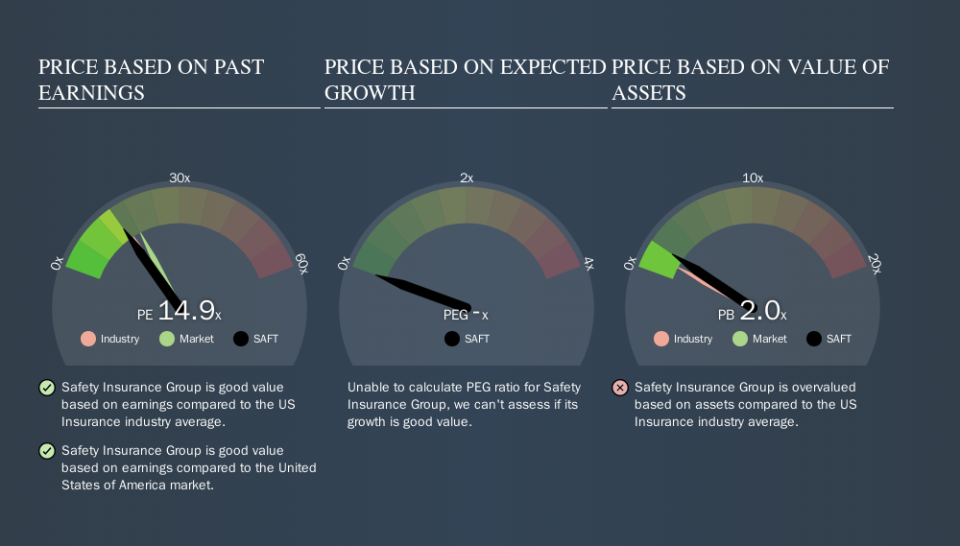
This article is for investors who would like to improve their understanding of price to earnings ratios (P/E ratios). To keep it practical, we'll show how Safety Insurance Group, Inc.'s (NASDAQ:SAFT) P/E ratio could help you assess the value on offer. Based on the last twelve months, Safety Insurance Group's P/E ratio is 14.91. In other words, at today's prices, investors are paying $14.91 for every $1 in prior year profit.
Check out our latest analysis for Safety Insurance Group
How Do You Calculate A P/E Ratio?
The formula for P/E is:
Price to Earnings Ratio = Share Price ÷ Earnings per Share (EPS)
Or for Safety Insurance Group:
P/E of 14.91 = $100.99 ÷ $6.78 (Based on the trailing twelve months to June 2019.)
Is A High P/E Ratio Good?
A higher P/E ratio means that buyers have to pay a higher price for each $1 the company has earned over the last year. All else being equal, it's better to pay a low price -- but as Warren Buffett said, 'It's far better to buy a wonderful company at a fair price than a fair company at a wonderful price.'
Does Safety Insurance Group Have A Relatively High Or Low P/E For Its Industry?
We can get an indication of market expectations by looking at the P/E ratio. You can see in the image below that the average P/E (15.8) for companies in the insurance industry is roughly the same as Safety Insurance Group's P/E.
Safety Insurance Group's P/E tells us that market participants think its prospects are roughly in line with its industry. The company could surprise by performing better than average, in the future. I would further inform my view by checking insider buying and selling., among other things.
How Growth Rates Impact P/E Ratios
P/E ratios primarily reflect market expectations around earnings growth rates. If earnings are growing quickly, then the 'E' in the equation will increase faster than it would otherwise. That means even if the current P/E is high, it will reduce over time if the share price stays flat. A lower P/E should indicate the stock is cheap relative to others -- and that may attract buyers.
In the last year, Safety Insurance Group grew EPS like Taylor Swift grew her fan base back in 2010; the 57% gain was both fast and well deserved. And earnings per share have improved by 22% annually, over the last three years. So we'd absolutely expect it to have a relatively high P/E ratio.
Don't Forget: The P/E Does Not Account For Debt or Bank Deposits
One drawback of using a P/E ratio is that it considers market capitalization, but not the balance sheet. So it won't reflect the advantage of cash, or disadvantage of debt. Theoretically, a business can improve its earnings (and produce a lower P/E in the future) by investing in growth. That means taking on debt (or spending its cash).
Such expenditure might be good or bad, in the long term, but the point here is that the balance sheet is not reflected by this ratio.
So What Does Safety Insurance Group's Balance Sheet Tell Us?
Safety Insurance Group has net cash of US$38m. That should lead to a higher P/E than if it did have debt, because its strong balance sheets gives it more options.
The Bottom Line On Safety Insurance Group's P/E Ratio
Safety Insurance Group trades on a P/E ratio of 14.9, which is below the US market average of 18.2. Not only should the net cash position reduce risk, but the recent growth has been impressive. The below average P/E ratio suggests that market participants don't believe the strong growth will continue.
Investors should be looking to buy stocks that the market is wrong about. If the reality for a company is not as bad as the P/E ratio indicates, then the share price should increase as the market realizes this. We don't have analyst forecasts, but you could get a better understanding of its growth by checking out this more detailed historical graph of earnings, revenue and cash flow.
Of course you might be able to find a better stock than Safety Insurance Group. So you may wish to see this free collection of other companies that have grown earnings strongly.
We aim to bring you long-term focused research analysis driven by fundamental data. Note that our analysis may not factor in the latest price-sensitive company announcements or qualitative material.
If you spot an error that warrants correction, please contact the editor at editorial-team@simplywallst.com. This article by Simply Wall St is general in nature. It does not constitute a recommendation to buy or sell any stock, and does not take account of your objectives, or your financial situation. Simply Wall St has no position in the stocks mentioned. Thank you for reading.
