
 Yahoo Finance
 Here's What The PNC Financial Services Group, Inc.'s (NYSE:PNC) P/E Is Telling Us

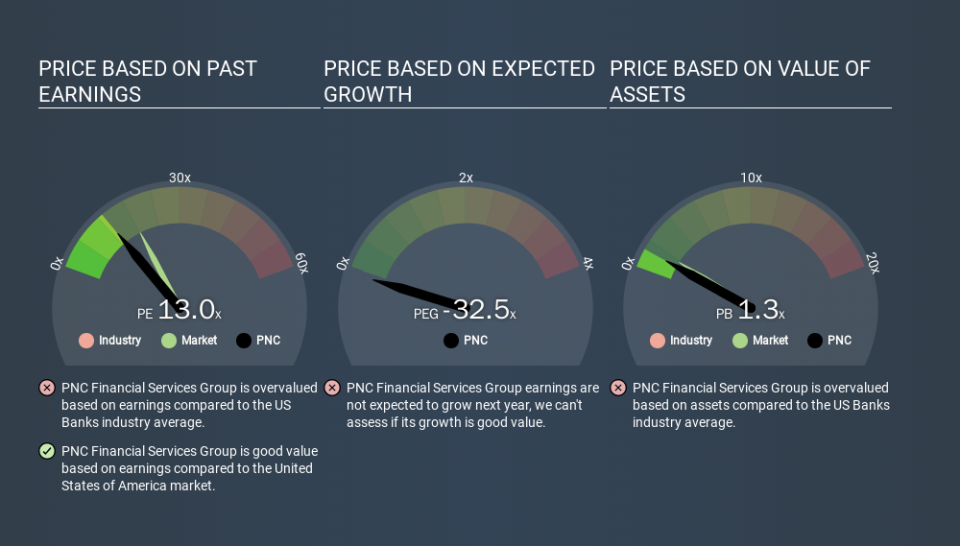
The goal of this article is to teach you how to use price to earnings ratios (P/E ratios). We'll apply a basic P/E ratio analysis to The PNC Financial Services Group, Inc.'s (NYSE:PNC), to help you decide if the stock is worth further research. Looking at earnings over the last twelve months, PNC Financial Services Group has a P/E ratio of 13.02. In other words, at today's prices, investors are paying $13.02 for every $1 in prior year profit.
View our latest analysis for PNC Financial Services Group
How Do I Calculate PNC Financial Services Group's Price To Earnings Ratio?
The formula for price to earnings is:
Price to Earnings Ratio = Share Price ÷ Earnings per Share (EPS)
Or for PNC Financial Services Group:
P/E of 13.02 = USD148.81 ÷ USD11.43 (Based on the year to December 2019.)
Is A High P/E Ratio Good?
A higher P/E ratio means that investors are paying a higher price for each USD1 of company earnings. That isn't necessarily good or bad, but a high P/E implies relatively high expectations of what a company can achieve in the future.
How Does PNC Financial Services Group's P/E Ratio Compare To Its Peers?
We can get an indication of market expectations by looking at the P/E ratio. As you can see below PNC Financial Services Group has a P/E ratio that is fairly close for the average for the banks industry, which is 12.4.
That indicates that the market expects PNC Financial Services Group will perform roughly in line with other companies in its industry. If the company has better than average prospects, then the market might be underestimating it. Checking factors such as director buying and selling. could help you form your own view on if that will happen.
How Growth Rates Impact P/E Ratios
P/E ratios primarily reflect market expectations around earnings growth rates. When earnings grow, the 'E' increases, over time. And in that case, the P/E ratio itself will drop rather quickly. Then, a lower P/E should attract more buyers, pushing the share price up.
PNC Financial Services Group's earnings per share grew by -5.9% in the last twelve months. And earnings per share have improved by 9.0% annually, over the last five years.
Remember: P/E Ratios Don't Consider The Balance Sheet
Don't forget that the P/E ratio considers market capitalization. So it won't reflect the advantage of cash, or disadvantage of debt. The exact same company would hypothetically deserve a higher P/E ratio if it had a strong balance sheet, than if it had a weak one with lots of debt, because a cashed up company can spend on growth.
Such spending might be good or bad, overall, but the key point here is that you need to look at debt to understand the P/E ratio in context.
Is Debt Impacting PNC Financial Services Group's P/E?
PNC Financial Services Group has net debt worth 82% of its market capitalization. If you want to compare its P/E ratio to other companies, you should absolutely keep in mind it has significant borrowings.
The Verdict On PNC Financial Services Group's P/E Ratio
PNC Financial Services Group's P/E is 13.0 which is below average (17.7) in the US market. The meaningful debt load is probably contributing to low expectations, even though it has improved earnings recently.
When the market is wrong about a stock, it gives savvy investors an opportunity. As value investor Benjamin Graham famously said, 'In the short run, the market is a voting machine but in the long run, it is a weighing machine. So this free report on the analyst consensus forecasts could help you make a master move on this stock.
But note: PNC Financial Services Group may not be the best stock to buy. So take a peek at this free list of interesting companies with strong recent earnings growth (and a P/E ratio below 20).
If you spot an error that warrants correction, please contact the editor at editorial-team@simplywallst.com. This article by Simply Wall St is general in nature. It does not constitute a recommendation to buy or sell any stock, and does not take account of your objectives, or your financial situation. Simply Wall St has no position in the stocks mentioned.
We aim to bring you long-term focused research analysis driven by fundamental data. Note that our analysis may not factor in the latest price-sensitive company announcements or qualitative material. Thank you for reading.
