
 Yahoo Finance
 Here's What Pembina Pipeline Corporation's (TSE:PPL) P/E Is Telling Us

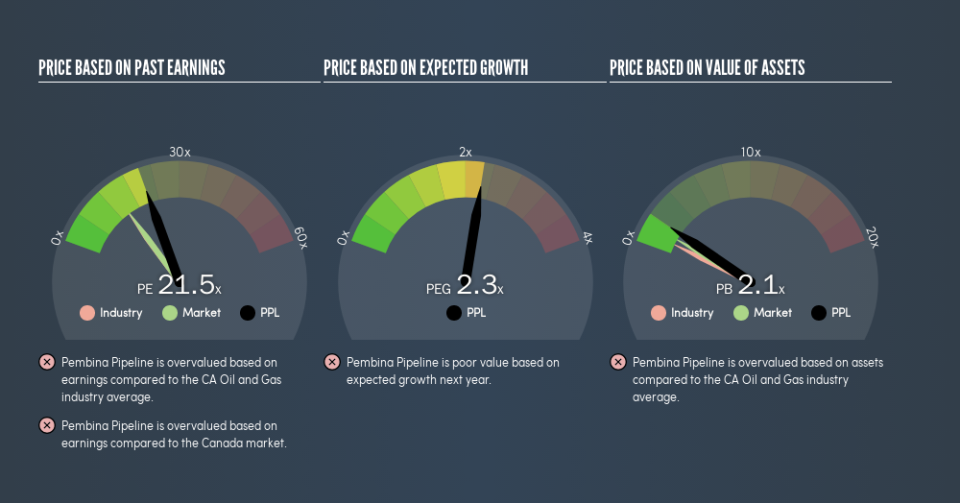
This article is for investors who would like to improve their understanding of price to earnings ratios (P/E ratios). We'll look at Pembina Pipeline Corporation's (TSE:PPL) P/E ratio and reflect on what it tells us about the company's share price. Pembina Pipeline has a price to earnings ratio of 21.46, based on the last twelve months. That corresponds to an earnings yield of approximately 4.7%.
Want to participate in a short research study? Help shape the future of investing tools and you could win a $250 gift card!
Check out our latest analysis for Pembina Pipeline
How Do I Calculate Pembina Pipeline's Price To Earnings Ratio?
The formula for price to earnings is:
Price to Earnings Ratio = Price per Share ÷ Earnings per Share (EPS)
Or for Pembina Pipeline:
P/E of 21.46 = CA$48.09 ÷ CA$2.24 (Based on the trailing twelve months to March 2019.)
Is A High P/E Ratio Good?
The higher the P/E ratio, the higher the price tag of a business, relative to its trailing earnings. That is not a good or a bad thing per se, but a high P/E does imply buyers are optimistic about the future.
How Growth Rates Impact P/E Ratios
Earnings growth rates have a big influence on P/E ratios. If earnings are growing quickly, then the 'E' in the equation will increase faster than it would otherwise. And in that case, the P/E ratio itself will drop rather quickly. So while a stock may look expensive based on past earnings, it could be cheap based on future earnings.
Most would be impressed by Pembina Pipeline earnings growth of 12% in the last year. And it has bolstered its earnings per share by 12% per year over the last five years. With that performance, you might expect an above average P/E ratio.
How Does Pembina Pipeline's P/E Ratio Compare To Its Peers?
We can get an indication of market expectations by looking at the P/E ratio. You can see in the image below that the average P/E (14.3) for companies in the oil and gas industry is lower than Pembina Pipeline's P/E.
Its relatively high P/E ratio indicates that Pembina Pipeline shareholders think it will perform better than other companies in its industry classification. Shareholders are clearly optimistic, but the future is always uncertain. So further research is always essential. I often monitor director buying and selling.
Remember: P/E Ratios Don't Consider The Balance Sheet
Don't forget that the P/E ratio considers market capitalization. That means it doesn't take debt or cash into account. The exact same company would hypothetically deserve a higher P/E ratio if it had a strong balance sheet, than if it had a weak one with lots of debt, because a cashed up company can spend on growth.
Such spending might be good or bad, overall, but the key point here is that you need to look at debt to understand the P/E ratio in context.
Pembina Pipeline's Balance Sheet
Pembina Pipeline's net debt equates to 32% of its market capitalization. You'd want to be aware of this fact, but it doesn't bother us.
The Verdict On Pembina Pipeline's P/E Ratio
Pembina Pipeline's P/E is 21.5 which is above average (14.8) in the CA market. Its debt levels do not imperil its balance sheet and it is growing EPS strongly. Therefore, it's not particularly surprising that it has a above average P/E ratio.
Investors have an opportunity when market expectations about a stock are wrong. As value investor Benjamin Graham famously said, 'In the short run, the market is a voting machine but in the long run, it is a weighing machine.' So this free visual report on analyst forecasts could hold the key to an excellent investment decision.
But note: Pembina Pipeline may not be the best stock to buy. So take a peek at this free list of interesting companies with strong recent earnings growth (and a P/E ratio below 20).
We aim to bring you long-term focused research analysis driven by fundamental data. Note that our analysis may not factor in the latest price-sensitive company announcements or qualitative material.
If you spot an error that warrants correction, please contact the editor at editorial-team@simplywallst.com. This article by Simply Wall St is general in nature. It does not constitute a recommendation to buy or sell any stock, and does not take account of your objectives, or your financial situation. Simply Wall St has no position in the stocks mentioned. Thank you for reading.
