
 Yahoo Finance
 Here's How P/E Ratios Can Help Us Understand Livent Corporation (NYSE:LTHM)

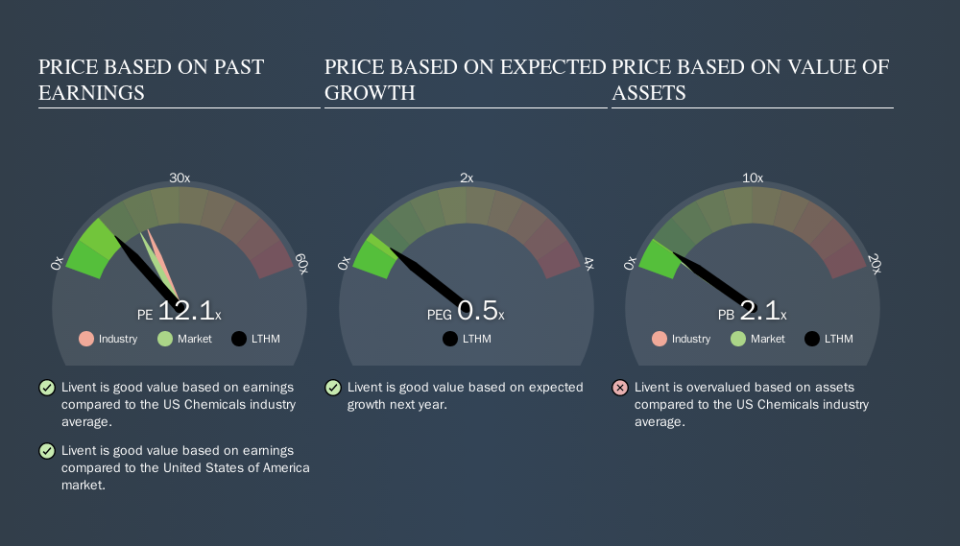
This article is written for those who want to get better at using price to earnings ratios (P/E ratios). We'll look at Livent Corporation's (NYSE:LTHM) P/E ratio and reflect on what it tells us about the company's share price. Livent has a price to earnings ratio of 12.07, based on the last twelve months. In other words, at today's prices, investors are paying $12.07 for every $1 in prior year profit.
Check out our latest analysis for Livent
How Do You Calculate A P/E Ratio?
The formula for price to earnings is:
Price to Earnings Ratio = Share Price ÷ Earnings per Share (EPS)
Or for Livent:
P/E of 12.07 = $7.66 ÷ $0.63 (Based on the year to June 2019.)
Is A High Price-to-Earnings Ratio Good?
A higher P/E ratio implies that investors pay a higher price for the earning power of the business. That isn't a good or a bad thing on its own, but a high P/E means that buyers have a higher opinion of the business's prospects, relative to stocks with a lower P/E.
How Does Livent's P/E Ratio Compare To Its Peers?
The P/E ratio indicates whether the market has higher or lower expectations of a company. We can see in the image below that the average P/E (20.6) for companies in the chemicals industry is higher than Livent's P/E.
This suggests that market participants think Livent will underperform other companies in its industry. While current expectations are low, the stock could be undervalued if the situation is better than the market assumes. If you consider the stock interesting, further research is recommended. For example, I often monitor director buying and selling.
How Growth Rates Impact P/E Ratios
Earnings growth rates have a big influence on P/E ratios. That's because companies that grow earnings per share quickly will rapidly increase the 'E' in the equation. That means unless the share price increases, the P/E will reduce in a few years. A lower P/E should indicate the stock is cheap relative to others -- and that may attract buyers.
Livent increased earnings per share by an impressive 20% over the last twelve months. And earnings per share have improved by 11% annually, over the last five years. This could arguably justify a relatively high P/E ratio.
Don't Forget: The P/E Does Not Account For Debt or Bank Deposits
Don't forget that the P/E ratio considers market capitalization. So it won't reflect the advantage of cash, or disadvantage of debt. Hypothetically, a company could reduce its future P/E ratio by spending its cash (or taking on debt) to achieve higher earnings.
Spending on growth might be good or bad a few years later, but the point is that the P/E ratio does not account for the option (or lack thereof).
So What Does Livent's Balance Sheet Tell Us?
Net debt totals just 3.5% of Livent's market cap. So it doesn't have as many options as it would with net cash, but its debt would not have much of an impact on its P/E ratio.
The Bottom Line On Livent's P/E Ratio
Livent has a P/E of 12.1. That's below the average in the US market, which is 18.2. The EPS growth last year was strong, and debt levels are quite reasonable. If it continues to grow, then the current low P/E may prove to be unjustified.
Investors have an opportunity when market expectations about a stock are wrong. If the reality for a company is not as bad as the P/E ratio indicates, then the share price should increase as the market realizes this. So this free visual report on analyst forecasts could hold the key to an excellent investment decision.
You might be able to find a better buy than Livent. If you want a selection of possible winners, check out this free list of interesting companies that trade on a P/E below 20 (but have proven they can grow earnings).
We aim to bring you long-term focused research analysis driven by fundamental data. Note that our analysis may not factor in the latest price-sensitive company announcements or qualitative material.
If you spot an error that warrants correction, please contact the editor at editorial-team@simplywallst.com. This article by Simply Wall St is general in nature. It does not constitute a recommendation to buy or sell any stock, and does not take account of your objectives, or your financial situation. Simply Wall St has no position in the stocks mentioned. Thank you for reading.
