
 Yahoo Finance
 Here's How P/E Ratios Can Help Us Understand TTM Technologies, Inc. (NASDAQ:TTMI)

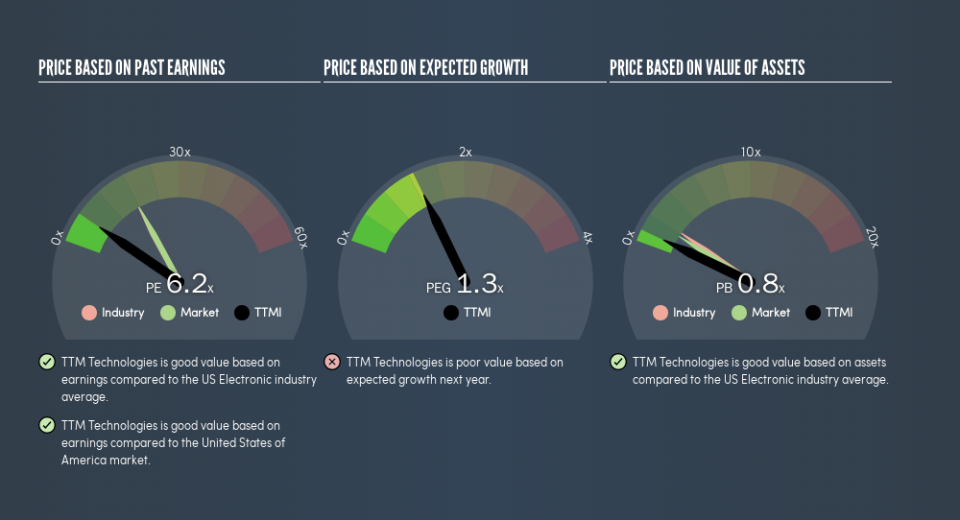
This article is written for those who want to get better at using price to earnings ratios (P/E ratios). We'll look at TTM Technologies, Inc.'s (NASDAQ:TTMI) P/E ratio and reflect on what it tells us about the company's share price. TTM Technologies has a price to earnings ratio of 6.19, based on the last twelve months. That corresponds to an earnings yield of approximately 16%.
See our latest analysis for TTM Technologies
How Do I Calculate A Price To Earnings Ratio?
The formula for price to earnings is:
Price to Earnings Ratio = Share Price ÷ Earnings per Share (EPS)
Or for TTM Technologies:
P/E of 6.19 = $9.55 ÷ $1.54 (Based on the trailing twelve months to April 2019.)
Is A High Price-to-Earnings Ratio Good?
A higher P/E ratio means that investors are paying a higher price for each $1 of company earnings. That is not a good or a bad thing per se, but a high P/E does imply buyers are optimistic about the future.
How Does TTM Technologies's P/E Ratio Compare To Its Peers?
The P/E ratio indicates whether the market has higher or lower expectations of a company. We can see in the image below that the average P/E (17.8) for companies in the electronic industry is higher than TTM Technologies's P/E.
Its relatively low P/E ratio indicates that TTM Technologies shareholders think it will struggle to do as well as other companies in its industry classification. Many investors like to buy stocks when the market is pessimistic about their prospects. If you consider the stock interesting, further research is recommended. For example, I often monitor director buying and selling.
How Growth Rates Impact P/E Ratios
P/E ratios primarily reflect market expectations around earnings growth rates. When earnings grow, the 'E' increases, over time. That means unless the share price increases, the P/E will reduce in a few years. Then, a lower P/E should attract more buyers, pushing the share price up.
TTM Technologies's earnings made like a rocket, taking off 55% last year. The cherry on top is that the five year growth rate was an impressive 58% per year. So I'd be surprised if the P/E ratio was not above average.
Don't Forget: The P/E Does Not Account For Debt or Bank Deposits
Don't forget that the P/E ratio considers market capitalization. So it won't reflect the advantage of cash, or disadvantage of debt. The exact same company would hypothetically deserve a higher P/E ratio if it had a strong balance sheet, than if it had a weak one with lots of debt, because a cashed up company can spend on growth.
Such expenditure might be good or bad, in the long term, but the point here is that the balance sheet is not reflected by this ratio.
How Does TTM Technologies's Debt Impact Its P/E Ratio?
Net debt totals a substantial 123% of TTM Technologies's market cap. If you want to compare its P/E ratio to other companies, you must keep in mind that these debt levels would usually warrant a relatively low P/E.
The Bottom Line On TTM Technologies's P/E Ratio
TTM Technologies has a P/E of 6.2. That's below the average in the US market, which is 17.8. While the EPS growth last year was strong, the significant debt levels reduce the number of options available to management. If the company can continue to grow earnings, then the current P/E may be unjustifiably low.
When the market is wrong about a stock, it gives savvy investors an opportunity. If it is underestimating a company, investors can make money by buying and holding the shares until the market corrects itself. So this free report on the analyst consensus forecasts could help you make a master move on this stock.
You might be able to find a better buy than TTM Technologies. If you want a selection of possible winners, check out this free list of interesting companies that trade on a P/E below 20 (but have proven they can grow earnings).
We aim to bring you long-term focused research analysis driven by fundamental data. Note that our analysis may not factor in the latest price-sensitive company announcements or qualitative material.
If you spot an error that warrants correction, please contact the editor at editorial-team@simplywallst.com. This article by Simply Wall St is general in nature. It does not constitute a recommendation to buy or sell any stock, and does not take account of your objectives, or your financial situation. Simply Wall St has no position in the stocks mentioned. Thank you for reading.
