
 Yahoo Finance
 Here's How P/E Ratios Can Help Us Understand Canlan Ice Sports Corp. (TSE:ICE)

Want to participate in a short research study? Help shape the future of investing tools and you could win a $250 gift card!
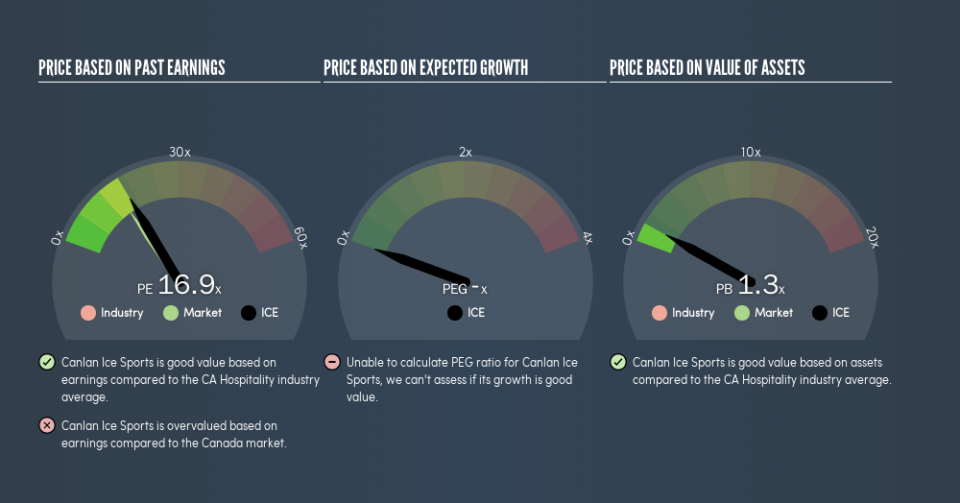
This article is for investors who would like to improve their understanding of price to earnings ratios (P/E ratios). We'll look at Canlan Ice Sports Corp.'s (TSE:ICE) P/E ratio and reflect on what it tells us about the company's share price. Canlan Ice Sports has a P/E ratio of 16.9, based on the last twelve months. That means that at current prices, buyers pay CA$16.9 for every CA$1 in trailing yearly profits.
Check out our latest analysis for Canlan Ice Sports
How Do I Calculate A Price To Earnings Ratio?
The formula for P/E is:
Price to Earnings Ratio = Share Price ÷ Earnings per Share (EPS)
Or for Canlan Ice Sports:
P/E of 16.9 = CA$5.1 ÷ CA$0.30 (Based on the year to March 2019.)
Is A High Price-to-Earnings Ratio Good?
A higher P/E ratio means that buyers have to pay a higher price for each CA$1 the company has earned over the last year. That is not a good or a bad thing per se, but a high P/E does imply buyers are optimistic about the future.
How Growth Rates Impact P/E Ratios
P/E ratios primarily reflect market expectations around earnings growth rates. If earnings are growing quickly, then the 'E' in the equation will increase faster than it would otherwise. And in that case, the P/E ratio itself will drop rather quickly. Then, a lower P/E should attract more buyers, pushing the share price up.
Canlan Ice Sports shrunk earnings per share by 11% over the last year. But over the longer term (5 years) earnings per share have increased by 21%.
How Does Canlan Ice Sports's P/E Ratio Compare To Its Peers?
We can get an indication of market expectations by looking at the P/E ratio. As you can see below Canlan Ice Sports has a P/E ratio that is fairly close for the average for the hospitality industry, which is 17.1.
That indicates that the market expects Canlan Ice Sports will perform roughly in line with other companies in its industry. The company could surprise by performing better than average, in the future. I would further inform my view by checking insider buying and selling., among other things.
Remember: P/E Ratios Don't Consider The Balance Sheet
One drawback of using a P/E ratio is that it considers market capitalization, but not the balance sheet. That means it doesn't take debt or cash into account. The exact same company would hypothetically deserve a higher P/E ratio if it had a strong balance sheet, than if it had a weak one with lots of debt, because a cashed up company can spend on growth.
Such expenditure might be good or bad, in the long term, but the point here is that the balance sheet is not reflected by this ratio.
Is Debt Impacting Canlan Ice Sports's P/E?
Canlan Ice Sports's net debt is 68% of its market cap. This is a reasonably significant level of debt -- all else being equal you'd expect a much lower P/E than if it had net cash.
The Verdict On Canlan Ice Sports's P/E Ratio
Canlan Ice Sports trades on a P/E ratio of 16.9, which is above the CA market average of 15.2. With significant debt and no EPS growth last year, shareholders are betting on an improvement in earnings from the company.
Investors have an opportunity when market expectations about a stock are wrong. People often underestimate remarkable growth -- so investors can make money when fast growth is not fully appreciated. We don't have analyst forecasts, but you might want to assess this data-rich visualization of earnings, revenue and cash flow.
Of course, you might find a fantastic investment by looking at a few good candidates. So take a peek at this free list of companies with modest (or no) debt, trading on a P/E below 20.
We aim to bring you long-term focused research analysis driven by fundamental data. Note that our analysis may not factor in the latest price-sensitive company announcements or qualitative material.
If you spot an error that warrants correction, please contact the editor at editorial-team@simplywallst.com. This article by Simply Wall St is general in nature. It does not constitute a recommendation to buy or sell any stock, and does not take account of your objectives, or your financial situation. Simply Wall St has no position in the stocks mentioned. Thank you for reading.
