
 Yahoo Finance
 Here's How P/E Ratios Can Help Us Understand Aecon Group Inc. (TSE:ARE)

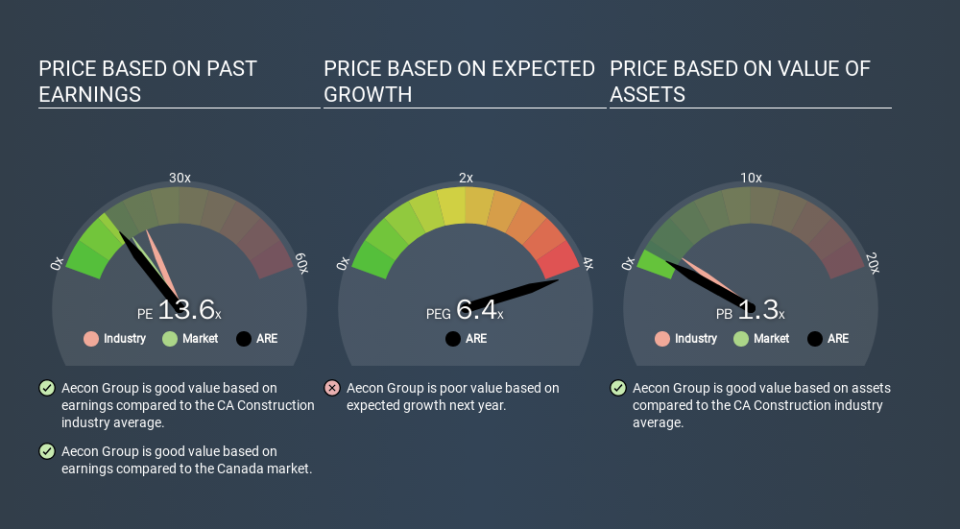
This article is written for those who want to get better at using price to earnings ratios (P/E ratios). To keep it practical, we'll show how Aecon Group Inc.'s (TSE:ARE) P/E ratio could help you assess the value on offer. Looking at earnings over the last twelve months, Aecon Group has a P/E ratio of 13.65. That is equivalent to an earnings yield of about 7.3%.
View our latest analysis for Aecon Group
How Do I Calculate A Price To Earnings Ratio?
The formula for P/E is:
Price to Earnings Ratio = Share Price ÷ Earnings per Share (EPS)
Or for Aecon Group:
P/E of 13.65 = CA$18.15 ÷ CA$1.33 (Based on the year to September 2019.)
Is A High Price-to-Earnings Ratio Good?
A higher P/E ratio means that investors are paying a higher price for each CA$1 of company earnings. That isn't a good or a bad thing on its own, but a high P/E means that buyers have a higher opinion of the business's prospects, relative to stocks with a lower P/E.
Does Aecon Group Have A Relatively High Or Low P/E For Its Industry?
The P/E ratio indicates whether the market has higher or lower expectations of a company. If you look at the image below, you can see Aecon Group has a lower P/E than the average (19.5) in the construction industry classification.
Aecon Group's P/E tells us that market participants think it will not fare as well as its peers in the same industry. While current expectations are low, the stock could be undervalued if the situation is better than the market assumes. You should delve deeper. I like to check if company insiders have been buying or selling.
How Growth Rates Impact P/E Ratios
P/E ratios primarily reflect market expectations around earnings growth rates. Earnings growth means that in the future the 'E' will be higher. Therefore, even if you pay a high multiple of earnings now, that multiple will become lower in the future. So while a stock may look expensive based on past earnings, it could be cheap based on future earnings.
In the last year, Aecon Group grew EPS like Taylor Swift grew her fan base back in 2010; the 52% gain was both fast and well deserved. The sweetener is that the annual five year growth rate of 19% is also impressive. So I'd be surprised if the P/E ratio was not above average.
Don't Forget: The P/E Does Not Account For Debt or Bank Deposits
Don't forget that the P/E ratio considers market capitalization. So it won't reflect the advantage of cash, or disadvantage of debt. In theory, a company can lower its future P/E ratio by using cash or debt to invest in growth.
While growth expenditure doesn't always pay off, the point is that it is a good option to have; but one that the P/E ratio ignores.
Is Debt Impacting Aecon Group's P/E?
Net debt totals 19% of Aecon Group's market cap. It would probably deserve a higher P/E ratio if it was net cash, since it would have more options for growth.
The Bottom Line On Aecon Group's P/E Ratio
Aecon Group trades on a P/E ratio of 13.6, which is below the CA market average of 15.5. The company hasn't stretched its balance sheet, and earnings growth was good last year. If the company can continue to grow earnings, then the current P/E may be unjustifiably low.
Investors should be looking to buy stocks that the market is wrong about. As value investor Benjamin Graham famously said, 'In the short run, the market is a voting machine but in the long run, it is a weighing machine. So this free visualization of the analyst consensus on future earnings could help you make the right decision about whether to buy, sell, or hold.
Of course, you might find a fantastic investment by looking at a few good candidates. So take a peek at this free list of companies with modest (or no) debt, trading on a P/E below 20.
If you spot an error that warrants correction, please contact the editor at editorial-team@simplywallst.com. This article by Simply Wall St is general in nature. It does not constitute a recommendation to buy or sell any stock, and does not take account of your objectives, or your financial situation. Simply Wall St has no position in the stocks mentioned.
We aim to bring you long-term focused research analysis driven by fundamental data. Note that our analysis may not factor in the latest price-sensitive company announcements or qualitative material. Thank you for reading.
