
 Yahoo Finance
 Here's How P/E Ratios Can Help Us Understand NMC Health Plc (LON:NMC)

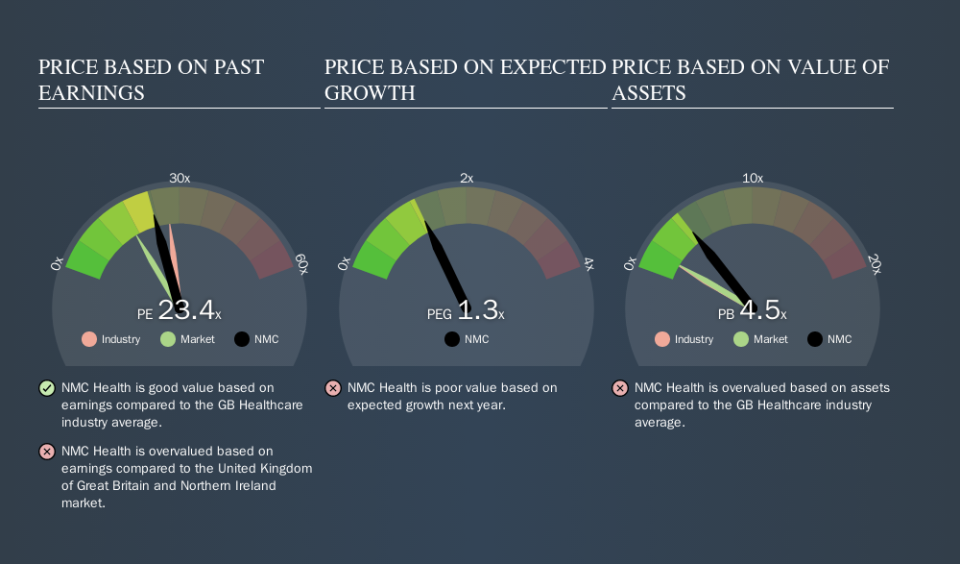
This article is written for those who want to get better at using price to earnings ratios (P/E ratios). To keep it practical, we'll show how NMC Health Plc's (LON:NMC) P/E ratio could help you assess the value on offer. NMC Health has a P/E ratio of 23.43, based on the last twelve months. In other words, at today's prices, investors are paying £23.43 for every £1 in prior year profit.
Check out our latest analysis for NMC Health
How Do You Calculate A P/E Ratio?
The formula for price to earnings is:
Price to Earnings Ratio = Share Price (in reporting currency) ÷ Earnings per Share (EPS)
Or for NMC Health:
P/E of 23.43 = £30.39 (Note: this is the share price in the reporting currency, namely, USD ) ÷ £1.30 (Based on the trailing twelve months to June 2019.)
Is A High Price-to-Earnings Ratio Good?
A higher P/E ratio means that investors are paying a higher price for each £1 of company earnings. That isn't a good or a bad thing on its own, but a high P/E means that buyers have a higher opinion of the business's prospects, relative to stocks with a lower P/E.
How Does NMC Health's P/E Ratio Compare To Its Peers?
The P/E ratio indicates whether the market has higher or lower expectations of a company. If you look at the image below, you can see NMC Health has a lower P/E than the average (26.5) in the healthcare industry classification.
Its relatively low P/E ratio indicates that NMC Health shareholders think it will struggle to do as well as other companies in its industry classification. Since the market seems unimpressed with NMC Health, it's quite possible it could surprise on the upside. If you consider the stock interesting, further research is recommended. For example, I often monitor director buying and selling.
How Growth Rates Impact P/E Ratios
P/E ratios primarily reflect market expectations around earnings growth rates. If earnings are growing quickly, then the 'E' in the equation will increase faster than it would otherwise. And in that case, the P/E ratio itself will drop rather quickly. And as that P/E ratio drops, the company will look cheap, unless its share price increases.
Most would be impressed by NMC Health earnings growth of 24% in the last year. And earnings per share have improved by 26% annually, over the last five years. So one might expect an above average P/E ratio.
Remember: P/E Ratios Don't Consider The Balance Sheet
The 'Price' in P/E reflects the market capitalization of the company. That means it doesn't take debt or cash into account. Theoretically, a business can improve its earnings (and produce a lower P/E in the future) by investing in growth. That means taking on debt (or spending its cash).
Such spending might be good or bad, overall, but the key point here is that you need to look at debt to understand the P/E ratio in context.
So What Does NMC Health's Balance Sheet Tell Us?
NMC Health has net debt worth 24% of its market capitalization. This could bring some additional risk, and reduce the number of investment options for management; worth remembering if you compare its P/E to businesses without debt.
The Verdict On NMC Health's P/E Ratio
NMC Health trades on a P/E ratio of 23.4, which is above its market average of 16.8. While the company does use modest debt, its recent earnings growth is very good. So on this analysis it seems reasonable that its P/E ratio is above average.
When the market is wrong about a stock, it gives savvy investors an opportunity. People often underestimate remarkable growth -- so investors can make money when fast growth is not fully appreciated. So this free visualization of the analyst consensus on future earnings could help you make the right decision about whether to buy, sell, or hold.
But note: NMC Health may not be the best stock to buy. So take a peek at this free list of interesting companies with strong recent earnings growth (and a P/E ratio below 20).
We aim to bring you long-term focused research analysis driven by fundamental data. Note that our analysis may not factor in the latest price-sensitive company announcements or qualitative material.
If you spot an error that warrants correction, please contact the editor at editorial-team@simplywallst.com. This article by Simply Wall St is general in nature. It does not constitute a recommendation to buy or sell any stock, and does not take account of your objectives, or your financial situation. Simply Wall St has no position in the stocks mentioned. Thank you for reading.
