
 Yahoo Finance
 Here's What To Make Of Metcash's (ASX:MTS) Decelerating Rates Of Return
Did you know there are some financial metrics that can provide clues of a potential multi-bagger? Amongst other things, we'll want to see two things; firstly, a growing return on capital employed (ROCE) and secondly, an expansion in the company's amount of capital employed. If you see this, it typically means it's a company with a great business model and plenty of profitable reinvestment opportunities. So, when we ran our eye over Metcash's (ASX:MTS) trend of ROCE, we liked what we saw.
Return On Capital Employed (ROCE): What Is It?
Just to clarify if you're unsure, ROCE is a metric for evaluating how much pre-tax income (in percentage terms) a company earns on the capital invested in its business. To calculate this metric for Metcash, this is the formula:
Return on Capital Employed = Earnings Before Interest and Tax (EBIT) ÷ (Total Assets - Current Liabilities)
0.18 = AU$460m ÷ (AU$5.8b - AU$3.2b) (Based on the trailing twelve months to October 2023).
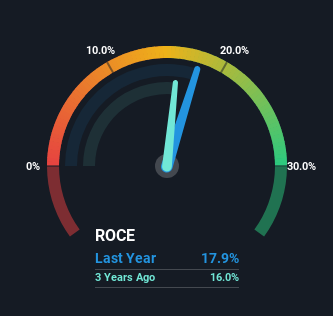
So, Metcash has an ROCE of 18%. In absolute terms, that's a satisfactory return, but compared to the Consumer Retailing industry average of 14% it's much better.
See our latest analysis for Metcash
In the above chart we have measured Metcash's prior ROCE against its prior performance, but the future is arguably more important. If you'd like, you can check out the forecasts from the analysts covering Metcash here for free.
So How Is Metcash's ROCE Trending?
While the current returns on capital are decent, they haven't changed much. Over the past five years, ROCE has remained relatively flat at around 18% and the business has deployed 68% more capital into its operations. Since 18% is a moderate ROCE though, it's good to see a business can continue to reinvest at these decent rates of return. Stable returns in this ballpark can be unexciting, but if they can be maintained over the long run, they often provide nice rewards to shareholders.
On a side note, Metcash's current liabilities are still rather high at 56% of total assets. This can bring about some risks because the company is basically operating with a rather large reliance on its suppliers or other sorts of short-term creditors. Ideally we'd like to see this reduce as that would mean fewer obligations bearing risks.
The Key Takeaway
In the end, Metcash has proven its ability to adequately reinvest capital at good rates of return. And since the stock has risen strongly over the last five years, it appears the market might expect this trend to continue. So while the positive underlying trends may be accounted for by investors, we still think this stock is worth looking into further.
If you want to continue researching Metcash, you might be interested to know about the 1 warning sign that our analysis has discovered.
For those who like to invest in solid companies, check out this free list of companies with solid balance sheets and high returns on equity.
Have feedback on this article? Concerned about the content? Get in touch with us directly. Alternatively, email editorial-team (at) simplywallst.com.
This article by Simply Wall St is general in nature. We provide commentary based on historical data and analyst forecasts only using an unbiased methodology and our articles are not intended to be financial advice. It does not constitute a recommendation to buy or sell any stock, and does not take account of your objectives, or your financial situation. We aim to bring you long-term focused analysis driven by fundamental data. Note that our analysis may not factor in the latest price-sensitive company announcements or qualitative material. Simply Wall St has no position in any stocks mentioned.
