
 Yahoo Finance
 Here's What Exelon Corporation's (NYSE:EXC) P/E Ratio Is Telling Us

Want to participate in a short research study? Help shape the future of investing tools and you could win a $250 gift card!
The goal of this article is to teach you how to use price to earnings ratios (P/E ratios). We'll apply a basic P/E ratio analysis to Exelon Corporation's (NYSE:EXC), to help you decide if the stock is worth further research. What is Exelon's P/E ratio? Well, based on the last twelve months it is 20.74. That means that at current prices, buyers pay $20.74 for every $1 in trailing yearly profits.
View our latest analysis for Exelon
How Do I Calculate Exelon's Price To Earnings Ratio?
The formula for price to earnings is:
Price to Earnings Ratio = Price per Share ÷ Earnings per Share (EPS)
Or for Exelon:
P/E of 20.74 = $49.95 ÷ $2.41 (Based on the year to March 2019.)
Is A High Price-to-Earnings Ratio Good?
A higher P/E ratio means that investors are paying a higher price for each $1 of company earnings. That is not a good or a bad thing per se, but a high P/E does imply buyers are optimistic about the future.
How Growth Rates Impact P/E Ratios
Probably the most important factor in determining what P/E a company trades on is the earnings growth. When earnings grow, the 'E' increases, over time. Therefore, even if you pay a high multiple of earnings now, that multiple will become lower in the future. Then, a lower P/E should attract more buyers, pushing the share price up.
Exelon shrunk earnings per share by 32% over the last year. But EPS is up 2.6% over the last 5 years.
Does Exelon Have A Relatively High Or Low P/E For Its Industry?
We can get an indication of market expectations by looking at the P/E ratio. The image below shows that Exelon has a P/E ratio that is roughly in line with the electric utilities industry average (22.4).
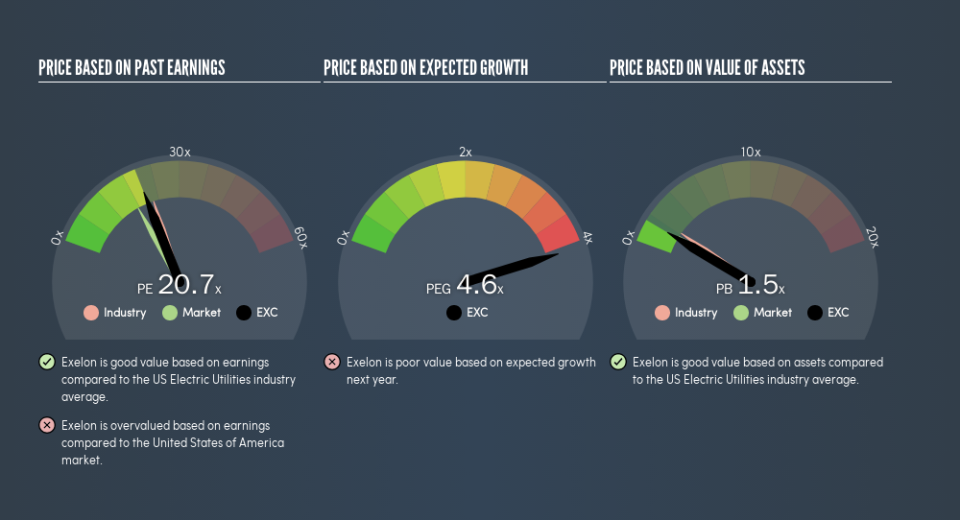
Its P/E ratio suggests that Exelon shareholders think that in the future it will perform about the same as other companies in its industry classification. So if Exelon actually outperforms its peers going forward, that should be a positive for the share price. Further research into factors such asmanagement tenure, could help you form your own view on whether that is likely.
A Limitation: P/E Ratios Ignore Debt and Cash In The Bank
It's important to note that the P/E ratio considers the market capitalization, not the enterprise value. In other words, it does not consider any debt or cash that the company may have on the balance sheet. Hypothetically, a company could reduce its future P/E ratio by spending its cash (or taking on debt) to achieve higher earnings.
Such expenditure might be good or bad, in the long term, but the point here is that the balance sheet is not reflected by this ratio.
Exelon's Balance Sheet
Exelon's net debt is 75% of its market cap. This is enough debt that you'd have to make some adjustments before using the P/E ratio to compare it to a company with net cash.
The Verdict On Exelon's P/E Ratio
Exelon has a P/E of 20.7. That's higher than the average in the US market, which is 17.5. With significant debt and no EPS growth last year, shareholders are betting on an improvement in earnings from the company.
Investors should be looking to buy stocks that the market is wrong about. If the reality for a company is better than it expects, you can make money by buying and holding for the long term. So this free visualization of the analyst consensus on future earnings could help you make the right decision about whether to buy, sell, or hold.
But note: Exelon may not be the best stock to buy. So take a peek at this free list of interesting companies with strong recent earnings growth (and a P/E ratio below 20).
We aim to bring you long-term focused research analysis driven by fundamental data. Note that our analysis may not factor in the latest price-sensitive company announcements or qualitative material.
If you spot an error that warrants correction, please contact the editor at editorial-team@simplywallst.com. This article by Simply Wall St is general in nature. It does not constitute a recommendation to buy or sell any stock, and does not take account of your objectives, or your financial situation. Simply Wall St has no position in the stocks mentioned. Thank you for reading.
