
 Yahoo Finance
 Here's What We Make Of Bri-Chem's (TSE:BRY) Returns On Capital

Want to participate in a short research study? Help shape the future of investing tools and earn a $40 gift card!
When we're researching a company, it's sometimes hard to find the warning signs, but there are some financial metrics that can help spot trouble early. Typically, we'll see the trend of both return on capital employed (ROCE) declining and this usually coincides with a decreasing amount of capital employed. Trends like this ultimately mean the business is reducing its investments and also earning less on what it has invested. Having said that, after a brief look, Bri-Chem (TSE:BRY) we aren't filled with optimism, but let's investigate further.
Return On Capital Employed (ROCE): What is it?
Just to clarify if you're unsure, ROCE is a metric for evaluating how much pre-tax income (in percentage terms) a company earns on the capital invested in its business. To calculate this metric for Bri-Chem, this is the formula:
Return on Capital Employed = Earnings Before Interest and Tax (EBIT) ÷ (Total Assets - Current Liabilities)
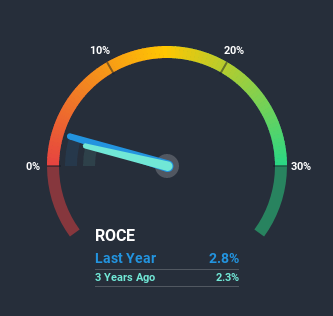
0.028 = CA$695k ÷ (CA$46m - CA$22m) (Based on the trailing twelve months to March 2020).
So, Bri-Chem has an ROCE of 2.8%. In absolute terms, that's a low return and it also under-performs the Trade Distributors industry average of 11%.
View our latest analysis for Bri-Chem
While the past is not representative of the future, it can be helpful to know how a company has performed historically, which is why we have this chart above. If you'd like to look at how Bri-Chem has performed in the past in other metrics, you can view this free graph of past earnings, revenue and cash flow.
What The Trend Of ROCE Can Tell Us
In terms of Bri-Chem's historical ROCE trend, it isn't fantastic. Unfortunately, returns have declined substantially over the last five years to the 2.8% we see today. What's equally concerning is that the amount of capital deployed in the business has shrunk by 53% over that same period. The combination of lower ROCE and less capital employed can indicate that a business is likely to be facing some competitive headwinds or seeing an erosion to its moat. If these underlying trends continue, we wouldn't be too optimistic going forward.
On a side note, Bri-Chem's current liabilities are still rather high at 47% of total assets. This can bring about some risks because the company is basically operating with a rather large reliance on its suppliers or other sorts of short-term creditors. While it's not necessarily a bad thing, it can be beneficial if this ratio is lower.
What We Can Learn From Bri-Chem's ROCE
In summary, it's unfortunate that Bri-Chem is shrinking its capital base and also generating lower returns. This could explain why the stock has sunk a total of 78% in the last five years. With underlying trends that aren't great in these areas, we'd consider looking elsewhere.
If you want to know some of the risks facing Bri-Chem we've found 2 warning signs (1 doesn't sit too well with us!) that you should be aware of before investing here.
If you want to search for solid companies with great earnings, check out this free list of companies with good balance sheets and impressive returns on equity.
This article by Simply Wall St is general in nature. It does not constitute a recommendation to buy or sell any stock, and does not take account of your objectives, or your financial situation. We aim to bring you long-term focused analysis driven by fundamental data. Note that our analysis may not factor in the latest price-sensitive company announcements or qualitative material. Simply Wall St has no position in any stocks mentioned.
Have feedback on this article? Concerned about the content? Get in touch with us directly. Alternatively, email editorial-team@simplywallst.com.
