
 Yahoo Finance
 Here's What To Make Of Bell Food Group's (VTX:BELL) Decelerating Rates Of Return
If we want to find a potential multi-bagger, often there are underlying trends that can provide clues. Amongst other things, we'll want to see two things; firstly, a growing return on capital employed (ROCE) and secondly, an expansion in the company's amount of capital employed. If you see this, it typically means it's a company with a great business model and plenty of profitable reinvestment opportunities. In light of that, when we looked at Bell Food Group (VTX:BELL) and its ROCE trend, we weren't exactly thrilled.
Understanding Return On Capital Employed (ROCE)
For those that aren't sure what ROCE is, it measures the amount of pre-tax profits a company can generate from the capital employed in its business. The formula for this calculation on Bell Food Group is:
Return on Capital Employed = Earnings Before Interest and Tax (EBIT) ÷ (Total Assets - Current Liabilities)
0.063 = CHF165m ÷ (CHF3.3b - CHF662m) (Based on the trailing twelve months to December 2023).
So, Bell Food Group has an ROCE of 6.3%. Ultimately, that's a low return and it under-performs the Food industry average of 13%.
View our latest analysis for Bell Food Group
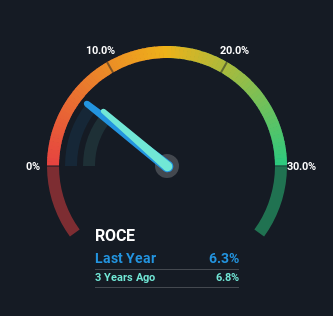
Above you can see how the current ROCE for Bell Food Group compares to its prior returns on capital, but there's only so much you can tell from the past. If you'd like, you can check out the forecasts from the analysts covering Bell Food Group for free.
What Does the ROCE Trend For Bell Food Group Tell Us?
Over the past five years, Bell Food Group's ROCE and capital employed have both remained mostly flat. It's not uncommon to see this when looking at a mature and stable business that isn't re-investing its earnings because it has likely passed that phase of the business cycle. So don't be surprised if Bell Food Group doesn't end up being a multi-bagger in a few years time. This probably explains why Bell Food Group is paying out 35% of its income to shareholders in the form of dividends. Unless businesses have highly compelling growth opportunities, they'll typically return some money to shareholders.
The Key Takeaway
In a nutshell, Bell Food Group has been trudging along with the same returns from the same amount of capital over the last five years. Unsurprisingly, the stock has only gained 4.9% over the last five years, which potentially indicates that investors are accounting for this going forward. So if you're looking for a multi-bagger, the underlying trends indicate you may have better chances elsewhere.
On a final note, we found 3 warning signs for Bell Food Group (1 is significant) you should be aware of.
If you want to search for solid companies with great earnings, check out this free list of companies with good balance sheets and impressive returns on equity.
Have feedback on this article? Concerned about the content? Get in touch with us directly. Alternatively, email editorial-team (at) simplywallst.com.
This article by Simply Wall St is general in nature. We provide commentary based on historical data and analyst forecasts only using an unbiased methodology and our articles are not intended to be financial advice. It does not constitute a recommendation to buy or sell any stock, and does not take account of your objectives, or your financial situation. We aim to bring you long-term focused analysis driven by fundamental data. Note that our analysis may not factor in the latest price-sensitive company announcements or qualitative material. Simply Wall St has no position in any stocks mentioned.
Have feedback on this article? Concerned about the content? Get in touch with us directly. Alternatively, email editorial-team@simplywallst.com
