
 Yahoo Finance
 Here's What Andrew Peller Limited's (TSE:ADW.A) P/E Ratio Is Telling Us

Today, we'll introduce the concept of the P/E ratio for those who are learning about investing. We'll show how you can use Andrew Peller Limited's (TSE:ADW.A) P/E ratio to inform your assessment of the investment opportunity. What is Andrew Peller's P/E ratio? Well, based on the last twelve months it is 25.39. In other words, at today's prices, investors are paying CA$25.39 for every CA$1 in prior year profit.
Check out our latest analysis for Andrew Peller
How Do I Calculate A Price To Earnings Ratio?
The formula for P/E is:
Price to Earnings Ratio = Price per Share ÷ Earnings per Share (EPS)
Or for Andrew Peller:
P/E of 25.39 = CA$13.33 ÷ CA$0.52 (Based on the trailing twelve months to June 2019.)
Is A High P/E Ratio Good?
A higher P/E ratio implies that investors pay a higher price for the earning power of the business. That isn't a good or a bad thing on its own, but a high P/E means that buyers have a higher opinion of the business's prospects, relative to stocks with a lower P/E.
How Does Andrew Peller's P/E Ratio Compare To Its Peers?
The P/E ratio essentially measures market expectations of a company. We can see in the image below that the average P/E (30.1) for companies in the beverage industry is higher than Andrew Peller's P/E.
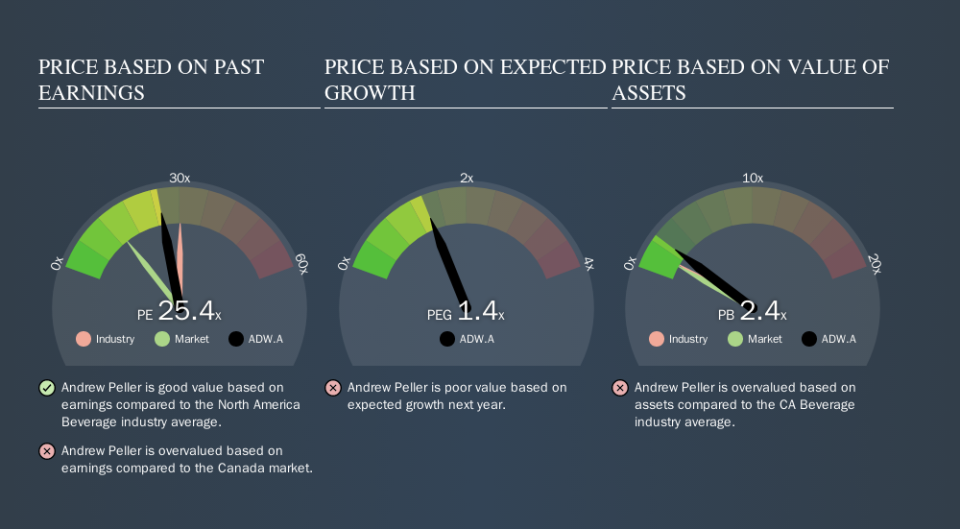
This suggests that market participants think Andrew Peller will underperform other companies in its industry. While current expectations are low, the stock could be undervalued if the situation is better than the market assumes. It is arguably worth checking if insiders are buying shares, because that might imply they believe the stock is undervalued.
How Growth Rates Impact P/E Ratios
Generally speaking the rate of earnings growth has a profound impact on a company's P/E multiple. When earnings grow, the 'E' increases, over time. That means unless the share price increases, the P/E will reduce in a few years. So while a stock may look expensive based on past earnings, it could be cheap based on future earnings.
Andrew Peller's earnings per share fell by 21% in the last twelve months. But it has grown its earnings per share by 12% per year over the last five years.
A Limitation: P/E Ratios Ignore Debt and Cash In The Bank
The 'Price' in P/E reflects the market capitalization of the company. That means it doesn't take debt or cash into account. Hypothetically, a company could reduce its future P/E ratio by spending its cash (or taking on debt) to achieve higher earnings.
Spending on growth might be good or bad a few years later, but the point is that the P/E ratio does not account for the option (or lack thereof).
So What Does Andrew Peller's Balance Sheet Tell Us?
Net debt is 26% of Andrew Peller's market cap. While it's worth keeping this in mind, it isn't a worry.
The Verdict On Andrew Peller's P/E Ratio
Andrew Peller trades on a P/E ratio of 25.4, which is above its market average of 13.6. With a bit of debt, but a lack of recent growth, it's safe to say the market is expecting improved profit performance from the company, in the next few years.
Investors should be looking to buy stocks that the market is wrong about. People often underestimate remarkable growth -- so investors can make money when fast growth is not fully appreciated. So this free visualization of the analyst consensus on future earnings could help you make the right decision about whether to buy, sell, or hold.
But note: Andrew Peller may not be the best stock to buy. So take a peek at this free list of interesting companies with strong recent earnings growth (and a P/E ratio below 20).
We aim to bring you long-term focused research analysis driven by fundamental data. Note that our analysis may not factor in the latest price-sensitive company announcements or qualitative material.
If you spot an error that warrants correction, please contact the editor at editorial-team@simplywallst.com. This article by Simply Wall St is general in nature. It does not constitute a recommendation to buy or sell any stock, and does not take account of your objectives, or your financial situation. Simply Wall St has no position in the stocks mentioned. Thank you for reading.
