
 Yahoo Finance
 Here's What To Make Of American Electric Power Company's (NASDAQ:AEP) Decelerating Rates Of Return
If you're not sure where to start when looking for the next multi-bagger, there are a few key trends you should keep an eye out for. In a perfect world, we'd like to see a company investing more capital into its business and ideally the returns earned from that capital are also increasing. Put simply, these types of businesses are compounding machines, meaning they are continually reinvesting their earnings at ever-higher rates of return. However, after briefly looking over the numbers, we don't think American Electric Power Company (NASDAQ:AEP) has the makings of a multi-bagger going forward, but let's have a look at why that may be.
Understanding Return On Capital Employed (ROCE)
Just to clarify if you're unsure, ROCE is a metric for evaluating how much pre-tax income (in percentage terms) a company earns on the capital invested in its business. To calculate this metric for American Electric Power Company, this is the formula:
Return on Capital Employed = Earnings Before Interest and Tax (EBIT) ÷ (Total Assets - Current Liabilities)
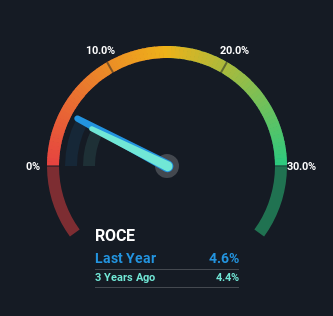
0.046 = US$4.0b ÷ (US$97b - US$12b) (Based on the trailing twelve months to December 2023).
Thus, American Electric Power Company has an ROCE of 4.6%. On its own that's a low return on capital but it's in line with the industry's average returns of 4.6%.
Check out our latest analysis for American Electric Power Company
Above you can see how the current ROCE for American Electric Power Company compares to its prior returns on capital, but there's only so much you can tell from the past. If you'd like, you can check out the forecasts from the analysts covering American Electric Power Company for free.
What Can We Tell From American Electric Power Company's ROCE Trend?
The returns on capital haven't changed much for American Electric Power Company in recent years. Over the past five years, ROCE has remained relatively flat at around 4.6% and the business has deployed 41% more capital into its operations. This poor ROCE doesn't inspire confidence right now, and with the increase in capital employed, it's evident that the business isn't deploying the funds into high return investments.
The Key Takeaway
In conclusion, American Electric Power Company has been investing more capital into the business, but returns on that capital haven't increased. And investors may be recognizing these trends since the stock has only returned a total of 21% to shareholders over the last five years. So if you're looking for a multi-bagger, the underlying trends indicate you may have better chances elsewhere.
One more thing: We've identified 3 warning signs with American Electric Power Company (at least 1 which is significant) , and understanding these would certainly be useful.
For those who like to invest in solid companies, check out this free list of companies with solid balance sheets and high returns on equity.
Have feedback on this article? Concerned about the content? Get in touch with us directly. Alternatively, email editorial-team (at) simplywallst.com.
This article by Simply Wall St is general in nature. We provide commentary based on historical data and analyst forecasts only using an unbiased methodology and our articles are not intended to be financial advice. It does not constitute a recommendation to buy or sell any stock, and does not take account of your objectives, or your financial situation. We aim to bring you long-term focused analysis driven by fundamental data. Note that our analysis may not factor in the latest price-sensitive company announcements or qualitative material. Simply Wall St has no position in any stocks mentioned.
