
 Yahoo Finance
 Henry Schein (NASDAQ:HSIC) Will Be Hoping To Turn Its Returns On Capital Around
If we want to find a potential multi-bagger, often there are underlying trends that can provide clues. One common approach is to try and find a company with returns on capital employed (ROCE) that are increasing, in conjunction with a growing amount of capital employed. If you see this, it typically means it's a company with a great business model and plenty of profitable reinvestment opportunities. Having said that, from a first glance at Henry Schein (NASDAQ:HSIC) we aren't jumping out of our chairs at how returns are trending, but let's have a deeper look.
What Is Return On Capital Employed (ROCE)?
For those who don't know, ROCE is a measure of a company's yearly pre-tax profit (its return), relative to the capital employed in the business. To calculate this metric for Henry Schein, this is the formula:
Return on Capital Employed = Earnings Before Interest and Tax (EBIT) ÷ (Total Assets - Current Liabilities)
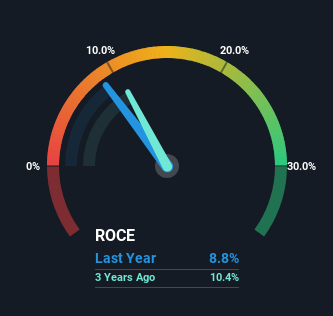
0.088 = US$695m ÷ (US$11b - US$2.7b) (Based on the trailing twelve months to December 2023).
Therefore, Henry Schein has an ROCE of 8.8%. In absolute terms, that's a low return but it's around the Healthcare industry average of 11%.
View our latest analysis for Henry Schein
In the above chart we have measured Henry Schein's prior ROCE against its prior performance, but the future is arguably more important. If you'd like to see what analysts are forecasting going forward, you should check out our free analyst report for Henry Schein .
What Does the ROCE Trend For Henry Schein Tell Us?
When we looked at the ROCE trend at Henry Schein, we didn't gain much confidence. To be more specific, ROCE has fallen from 13% over the last five years. On the other hand, the company has been employing more capital without a corresponding improvement in sales in the last year, which could suggest these investments are longer term plays. It's worth keeping an eye on the company's earnings from here on to see if these investments do end up contributing to the bottom line.
On a side note, Henry Schein has done well to pay down its current liabilities to 25% of total assets. That could partly explain why the ROCE has dropped. What's more, this can reduce some aspects of risk to the business because now the company's suppliers or short-term creditors are funding less of its operations. Some would claim this reduces the business' efficiency at generating ROCE since it is now funding more of the operations with its own money.
The Key Takeaway
To conclude, we've found that Henry Schein is reinvesting in the business, but returns have been falling. And investors may be recognizing these trends since the stock has only returned a total of 24% to shareholders over the last five years. Therefore, if you're looking for a multi-bagger, we'd propose looking at other options.
One more thing, we've spotted 2 warning signs facing Henry Schein that you might find interesting.
For those who like to invest in solid companies, check out this free list of companies with solid balance sheets and high returns on equity.
Have feedback on this article? Concerned about the content? Get in touch with us directly. Alternatively, email editorial-team (at) simplywallst.com.
This article by Simply Wall St is general in nature. We provide commentary based on historical data and analyst forecasts only using an unbiased methodology and our articles are not intended to be financial advice. It does not constitute a recommendation to buy or sell any stock, and does not take account of your objectives, or your financial situation. We aim to bring you long-term focused analysis driven by fundamental data. Note that our analysis may not factor in the latest price-sensitive company announcements or qualitative material. Simply Wall St has no position in any stocks mentioned.
