
 Yahoo Finance
 Should You Like Hemisphere Energy Corporation’s (CVE:HME) High Return On Capital Employed?

Today we'll evaluate Hemisphere Energy Corporation (CVE:HME) to determine whether it could have potential as an investment idea. In particular, we'll consider its Return On Capital Employed (ROCE), as that can give us insight into how profitably the company is able to employ capital in its business.
First, we'll go over how we calculate ROCE. Then we'll compare its ROCE to similar companies. And finally, we'll look at how its current liabilities are impacting its ROCE.
Understanding Return On Capital Employed (ROCE)
ROCE measures the 'return' (pre-tax profit) a company generates from capital employed in its business. Generally speaking a higher ROCE is better. Ultimately, it is a useful but imperfect metric. Renowned investment researcher Michael Mauboussin has suggested that a high ROCE can indicate that 'one dollar invested in the company generates value of more than one dollar'.
So, How Do We Calculate ROCE?
The formula for calculating the return on capital employed is:
Return on Capital Employed = Earnings Before Interest and Tax (EBIT) ÷ (Total Assets - Current Liabilities)
Or for Hemisphere Energy:
0.091 = CA$5.3m ÷ (CA$62m - CA$3.4m) (Based on the trailing twelve months to June 2019.)
Therefore, Hemisphere Energy has an ROCE of 9.1%.
View our latest analysis for Hemisphere Energy
Does Hemisphere Energy Have A Good ROCE?
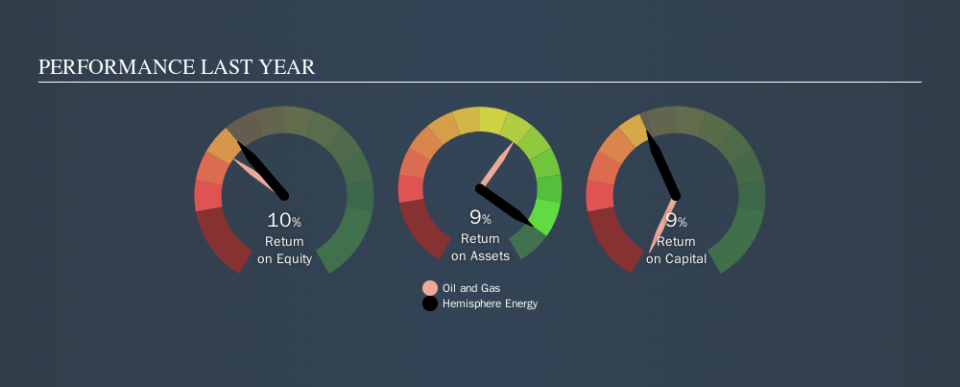
ROCE is commonly used for comparing the performance of similar businesses. In our analysis, Hemisphere Energy's ROCE is meaningfully higher than the 5.6% average in the Oil and Gas industry. I think that's good to see, since it implies the company is better than other companies at making the most of its capital. Aside from the industry comparison, Hemisphere Energy's ROCE is mediocre in absolute terms, considering the risk of investing in stocks versus the safety of a bank account. Readers may find more attractive investment prospects elsewhere.
Hemisphere Energy has an ROCE of 9.1%, but it didn't have an ROCE 3 years ago, since it was unprofitable. That suggests the business has returned to profitability. You can see in the image below how Hemisphere Energy's ROCE compares to its industry. Click to see more on past growth.
It is important to remember that ROCE shows past performance, and is not necessarily predictive. ROCE can be misleading for companies in cyclical industries, with returns looking impressive during the boom times, but very weak during the busts. ROCE is, after all, simply a snap shot of a single year. Given the industry it operates in, Hemisphere Energy could be considered cyclical. If Hemisphere Energy is cyclical, it could make sense to check out this free graph of past earnings, revenue and cash flow.
How Hemisphere Energy's Current Liabilities Impact Its ROCE
Current liabilities include invoices, such as supplier payments, short-term debt, or a tax bill, that need to be paid within 12 months. The ROCE equation subtracts current liabilities from capital employed, so a company with a lot of current liabilities appears to have less capital employed, and a higher ROCE than otherwise. To counteract this, we check if a company has high current liabilities, relative to its total assets.
Hemisphere Energy has total liabilities of CA$3.4m and total assets of CA$62m. Therefore its current liabilities are equivalent to approximately 5.5% of its total assets. Hemisphere Energy reports few current liabilities, which have a negligible impact on its unremarkable ROCE.
The Bottom Line On Hemisphere Energy's ROCE
If performance improves, then Hemisphere Energy may be an OK investment, especially at the right valuation. You might be able to find a better investment than Hemisphere Energy. If you want a selection of possible winners, check out this free list of interesting companies that trade on a P/E below 20 (but have proven they can grow earnings).
Hemisphere Energy is not the only stock insiders are buying. So take a peek at this free list of growing companies with insider buying.
We aim to bring you long-term focused research analysis driven by fundamental data. Note that our analysis may not factor in the latest price-sensitive company announcements or qualitative material.
If you spot an error that warrants correction, please contact the editor at editorial-team@simplywallst.com. This article by Simply Wall St is general in nature. It does not constitute a recommendation to buy or sell any stock, and does not take account of your objectives, or your financial situation. Simply Wall St has no position in the stocks mentioned. Thank you for reading.
