
 Yahoo Finance
 HELLA GmbH KGaA (ETR:HLE) shareholders have earned a 24% CAGR over the last three years
One simple way to benefit from the stock market is to buy an index fund. But many of us dare to dream of bigger returns, and build a portfolio ourselves. For example, the HELLA GmbH & Co. KGaA (ETR:HLE) share price is up 81% in the last three years, clearly besting the market decline of around 18% (not including dividends). On the other hand, the returns haven't been quite so good recently, with shareholders up just 8.6% , including dividends .
Let's take a look at the underlying fundamentals over the longer term, and see if they've been consistent with shareholders returns.
See our latest analysis for HELLA GmbH KGaA
While markets are a powerful pricing mechanism, share prices reflect investor sentiment, not just underlying business performance. One flawed but reasonable way to assess how sentiment around a company has changed is to compare the earnings per share (EPS) with the share price.
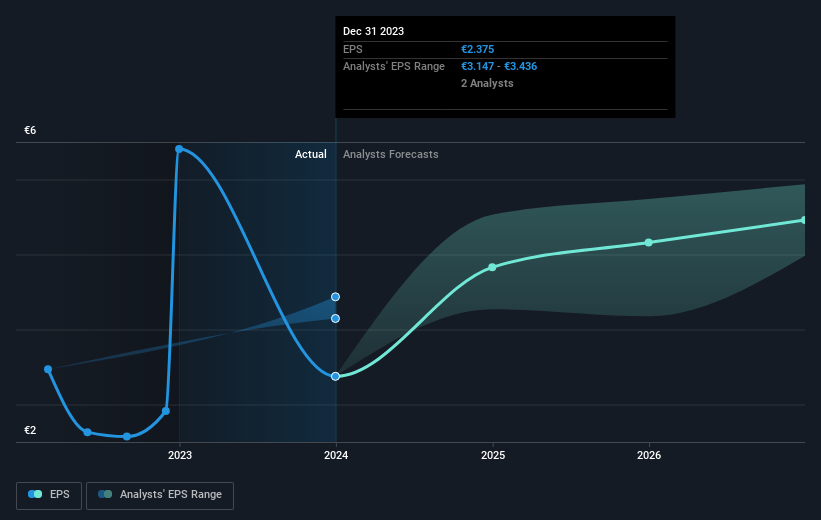
HELLA GmbH KGaA became profitable within the last three years. So we would expect a higher share price over the period.
The company's earnings per share (over time) is depicted in the image below (click to see the exact numbers).
Before buying or selling a stock, we always recommend a close examination of historic growth trends, available here.
What About Dividends?
It is important to consider the total shareholder return, as well as the share price return, for any given stock. Whereas the share price return only reflects the change in the share price, the TSR includes the value of dividends (assuming they were reinvested) and the benefit of any discounted capital raising or spin-off. Arguably, the TSR gives a more comprehensive picture of the return generated by a stock. In the case of HELLA GmbH KGaA, it has a TSR of 93% for the last 3 years. That exceeds its share price return that we previously mentioned. This is largely a result of its dividend payments!
A Different Perspective
We're pleased to report that HELLA GmbH KGaA shareholders have received a total shareholder return of 8.6% over one year. And that does include the dividend. Having said that, the five-year TSR of 14% a year, is even better. The pessimistic view would be that be that the stock has its best days behind it, but on the other hand the price might simply be moderating while the business itself continues to execute. While it is well worth considering the different impacts that market conditions can have on the share price, there are other factors that are even more important. Case in point: We've spotted 1 warning sign for HELLA GmbH KGaA you should be aware of.
If you like to buy stocks alongside management, then you might just love this free list of companies. (Hint: insiders have been buying them).
Please note, the market returns quoted in this article reflect the market weighted average returns of stocks that currently trade on German exchanges.
Have feedback on this article? Concerned about the content? Get in touch with us directly. Alternatively, email editorial-team (at) simplywallst.com.
This article by Simply Wall St is general in nature. We provide commentary based on historical data and analyst forecasts only using an unbiased methodology and our articles are not intended to be financial advice. It does not constitute a recommendation to buy or sell any stock, and does not take account of your objectives, or your financial situation. We aim to bring you long-term focused analysis driven by fundamental data. Note that our analysis may not factor in the latest price-sensitive company announcements or qualitative material. Simply Wall St has no position in any stocks mentioned.
