
 Yahoo Finance
 Heidrick & Struggles International (NASDAQ:HSII) Will Be Hoping To Turn Its Returns On Capital Around
What are the early trends we should look for to identify a stock that could multiply in value over the long term? Ideally, a business will show two trends; firstly a growing return on capital employed (ROCE) and secondly, an increasing amount of capital employed. This shows us that it's a compounding machine, able to continually reinvest its earnings back into the business and generate higher returns. Although, when we looked at Heidrick & Struggles International (NASDAQ:HSII), it didn't seem to tick all of these boxes.
Return On Capital Employed (ROCE): What Is It?
Just to clarify if you're unsure, ROCE is a metric for evaluating how much pre-tax income (in percentage terms) a company earns on the capital invested in its business. To calculate this metric for Heidrick & Struggles International, this is the formula:
Return on Capital Employed = Earnings Before Interest and Tax (EBIT) ÷ (Total Assets - Current Liabilities)
0.12 = US$84m ÷ (US$1.1b - US$439m) (Based on the trailing twelve months to December 2023).
Therefore, Heidrick & Struggles International has an ROCE of 12%. That's a relatively normal return on capital, and it's around the 13% generated by the Professional Services industry.
See our latest analysis for Heidrick & Struggles International
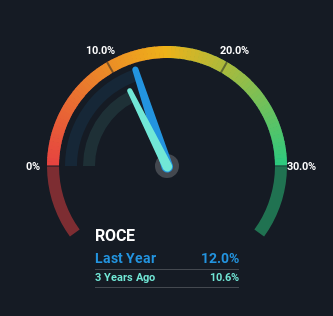
Above you can see how the current ROCE for Heidrick & Struggles International compares to its prior returns on capital, but there's only so much you can tell from the past. If you're interested, you can view the analysts predictions in our free analyst report for Heidrick & Struggles International .
What Can We Tell From Heidrick & Struggles International's ROCE Trend?
When we looked at the ROCE trend at Heidrick & Struggles International, we didn't gain much confidence. Around five years ago the returns on capital were 18%, but since then they've fallen to 12%. Meanwhile, the business is utilizing more capital but this hasn't moved the needle much in terms of sales in the past 12 months, so this could reflect longer term investments. It may take some time before the company starts to see any change in earnings from these investments.
The Bottom Line
In summary, Heidrick & Struggles International is reinvesting funds back into the business for growth but unfortunately it looks like sales haven't increased much just yet. And in the last five years, the stock has given away 15% so the market doesn't look too hopeful on these trends strengthening any time soon. In any case, the stock doesn't have these traits of a multi-bagger discussed above, so if that's what you're looking for, we think you'd have more luck elsewhere.
If you want to continue researching Heidrick & Struggles International, you might be interested to know about the 1 warning sign that our analysis has discovered.
While Heidrick & Struggles International may not currently earn the highest returns, we've compiled a list of companies that currently earn more than 25% return on equity. Check out this free list here.
Have feedback on this article? Concerned about the content? Get in touch with us directly. Alternatively, email editorial-team (at) simplywallst.com.
This article by Simply Wall St is general in nature. We provide commentary based on historical data and analyst forecasts only using an unbiased methodology and our articles are not intended to be financial advice. It does not constitute a recommendation to buy or sell any stock, and does not take account of your objectives, or your financial situation. We aim to bring you long-term focused analysis driven by fundamental data. Note that our analysis may not factor in the latest price-sensitive company announcements or qualitative material. Simply Wall St has no position in any stocks mentioned.
