
 Yahoo Finance
 Hawaiian Holdings Unit Releases Solid July Traffic Data
Hawaiian Holdings, Inc.’s HA wholly owned subsidiary, Hawaiian Airlines, reported impressive traffic figures for July. Traffic (measured in Revenue Passenger Miles or RPMs) increased 5.1% to around 1.55 billion.
Available Seat Miles (ASMs) also climbed 5% to 1.78 billion in the month. Load factor (percentage of seats filled by passengers) inched up 10 basis points (bps) to 87.4% as traffic growth outpaced capacity expansion.
In the first seven months of 2018, Hawaiian Airlines witnessed a 5.8% rise in RPMs to 9.92 billion. Also, ASMs rose 5.3% to 11.53 billion. As a result, load factor increased 40 bps to 86%. Additionally, passenger count grew 5.3% to 7 million in the period.
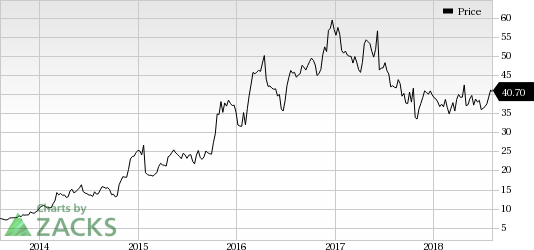
Hawaiian Holdings, Inc. Price
Hawaiian Holdings, Inc. Price | Hawaiian Holdings, Inc. Quote
This Zacks Rank #3 (Hold) company recently reported second-quarter financial numbers wherein earnings surpassed estimates but revenues missed the same. While earnings per share declined, revenues improved on a year-over-year basis. You can see the complete list of today’s Zacks #1 Rank (Strong Buy) stocks here.
For the third quarter, Hawaiian Airlines anticipates operating revenue per available seat mile to be down 1.5% to up 1.5% on a year-over-year basis. While capacity expansion is projected between 7.5% and 9.5%. Unit costs excluding fuel are estimated to rise significantly, primarily owing to escalating labor costs. Fuel cost per gallon (economic) is predicted in the band of $2.10-$2.20 for the current quarter.
Key airline players, namely American Airlines Group Inc. AAL, Southwest Airlines Co. LUV and Alaska Air Group, Inc. ALK also recently posted their second-quarter financial figures. Each of the carriers beat on earnings but missed on revenues.
More Stock News: This Is Bigger than the iPhone!
It could become the mother of all technological revolutions. Apple sold a mere 1 billion iPhones in 10 years but a new breakthrough is expected to generate more than 27 billion devices in just 3 years, creating a $1.7 trillion market.
Zacks has just released a Special Report that spotlights this fast-emerging phenomenon and 6 tickers for taking advantage of it. If you don't buy now, you may kick yourself in 2020.
Click here for the 6 trades >>
Want the latest recommendations from Zacks Investment Research? Today, you can download 7 Best Stocks for the Next 30 Days. Click to get this free report
Southwest Airlines Co. (LUV) : Free Stock Analysis Report
Hawaiian Holdings, Inc. (HA) : Free Stock Analysis Report
American Airlines Group Inc. (AAL) : Free Stock Analysis Report
Alaska Air Group, Inc. (ALK) : Free Stock Analysis Report
To read this article on Zacks.com click here.
