
 Yahoo Finance
 Hawaiian Holdings (HA) Incurs Loss in Q1, Load Factor Tanks
Hawaiian Holdings, Inc.’s HA first-quarter 2020 loss (excluding $2.40 from non-recurring items) of $1.00 per share was wider than the the Zacks Consensus Estimate of a loss of 74 cents. The carrier reported earnings of 67 cents in first-quarter 2019. Moreover, quarterly revenues of $559.1 million missed the Zacks Consensus Estimate of $564 million, down 14.9% year over year.
Due to massive drop in travel demand due to the COVID-19 pandemic, passenger revenues (accounting for 90% of the top line) declined 16.3% year over year. Airline traffic, measured in revenue passenger miles, fell 10.1% year over year to 3.71 billion in the quarter under review. Capacity or available seat miles (ASMs) expanded 2.6% to 4.97 billion. Load factor (percentage of seats filled by passengers) deteriorated 105 basis points to 74.6% in the reported quarter as capacity expanded while traffic declined.
Hawaiian Holdings, Inc. Price, Consensus and EPS Surprise
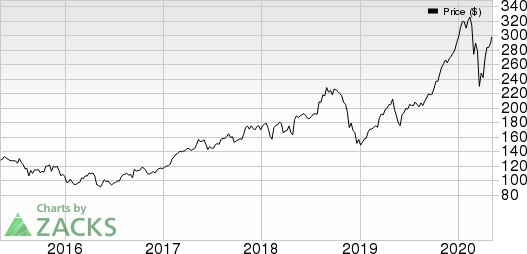
Hawaiian Holdings, Inc. price-consensus-eps-surprise-chart | Hawaiian Holdings, Inc. Quote
Meanwhile, operating revenue per available seat mile (RASM: a key measure of unit revenues) in the quarter fell 17.1% year over year. Average fuel cost per gallon (economic) dropped 8.5% to $1.83 in the first quarter, while non-fuel unit costs fell 0.9%.
Liquidity
As of Mar 31, 2020, this Zacks Rank #3 (Hold) company’s unrestricted cash, cash equivalents and short-term investments totaled $815 million. Outstanding debt and finance lease obligations were $976 million.
You can see the complete list of today’s Zacks #1 Rank (Strong Buy) stocks here.
Outlook
Due to COVID-19 pandemic uncertainties, Hawaiian Holdings is unable to provide its detailed guidance for second-quarter2020. ASM for April 2020 is expected to be approximately 94%, which indicates a decline from the year-ago period’s capacity. The company expects its May 2020 capacity to plunge 91% compared with the year-ago period’s tally. Operating expenses are expected to decline at a slower pace than capacity.
Sectorial Snapshot
Unlike Hawaiian Holdings, there are a few companies in the Zacks Transportation sector like Werner Enterprises, Inc. WERN, Union Pacific Corporation UNP and Canadian Pacific Railway Limited CP that have surpassed earnings estimates in first-quarter 2020.
Werner Enterprises reported first-quarter 2020 earnings per share (excluding 7 cents from non-recurring items) of 40 cents, which surpassed the Zacks Consensus Estimate of 35 cents. However, the bottom line declined 23.1% year over year.
Union Pacific’s first-quarter 2020 earnings of $2.15 per share surpassed the Zacks Consensus Estimate of $1.86. Moreover, the bottom line increased 11.4% on a year-over-year basis.
Canadian Pacific’s first-quarter 2020 earnings (excluding $1.08 from non-recurring items) of $3.3 (C$4.42) per share surpassed the Zacks Consensus Estimate of $2.86. Quarterly earnings surged more than 55% year over year.
Today's Best Stocks from Zacks
Would you like to see the updated picks from our best market-beating strategies? From 2017 through 2019, while the S&P 500 gained and impressive +53.6%, five of our strategies returned +65.8%, +97.1%, +118.0%, +175.7% and even +186.7%.
This outperformance has not just been a recent phenomenon. From 2000 – 2019, while the S&P averaged +6.0% per year, our top strategies averaged up to +54.7% per year.
See their latest picks free >>
Want the latest recommendations from Zacks Investment Research? Today, you can download 7 Best Stocks for the Next 30 Days. Click to get this free report
Union Pacific Corporation (UNP) : Free Stock Analysis Report
Canadian Pacific Railway Limited (CP) : Free Stock Analysis Report
Hawaiian Holdings Inc (HA) : Free Stock Analysis Report
Werner Enterprises Inc (WERN) : Free Stock Analysis Report
To read this article on Zacks.com click here.
Zacks Investment Research
