
 Yahoo Finance
 Hammond Manufacturing (TSE:HMM.A) shareholders have earned a 43% CAGR over the last five years
Hammond Manufacturing Company Limited (TSE:HMM.A) shareholders have seen the share price descend 18% over the month. But that doesn't undermine the fantastic longer term performance (measured over five years). Indeed, the share price is up a whopping 449% in that time. So it might be that some shareholders are taking profits after good performance. The most important thing for savvy investors to consider is whether the underlying business can justify the share price gain.
With that in mind, it's worth seeing if the company's underlying fundamentals have been the driver of long term performance, or if there are some discrepancies.
View our latest analysis for Hammond Manufacturing
To quote Buffett, 'Ships will sail around the world but the Flat Earth Society will flourish. There will continue to be wide discrepancies between price and value in the marketplace...' By comparing earnings per share (EPS) and share price changes over time, we can get a feel for how investor attitudes to a company have morphed over time.
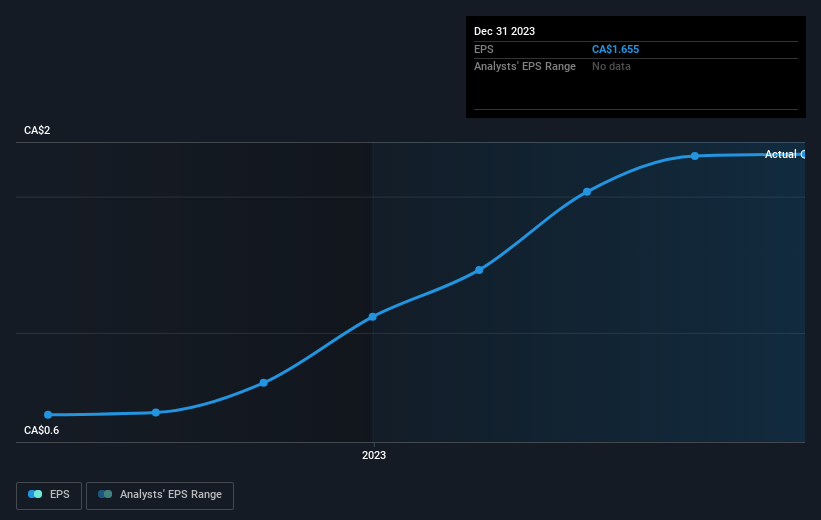
During five years of share price growth, Hammond Manufacturing achieved compound earnings per share (EPS) growth of 38% per year. This EPS growth is reasonably close to the 41% average annual increase in the share price. Therefore one could conclude that sentiment towards the shares hasn't morphed very much. Indeed, it would appear the share price is reacting to the EPS.
You can see how EPS has changed over time in the image below (click on the chart to see the exact values).
It might be well worthwhile taking a look at our free report on Hammond Manufacturing's earnings, revenue and cash flow.
What About Dividends?
As well as measuring the share price return, investors should also consider the total shareholder return (TSR). The TSR incorporates the value of any spin-offs or discounted capital raisings, along with any dividends, based on the assumption that the dividends are reinvested. It's fair to say that the TSR gives a more complete picture for stocks that pay a dividend. As it happens, Hammond Manufacturing's TSR for the last 5 years was 490%, which exceeds the share price return mentioned earlier. This is largely a result of its dividend payments!
A Different Perspective
It's nice to see that Hammond Manufacturing shareholders have received a total shareholder return of 83% over the last year. Of course, that includes the dividend. That's better than the annualised return of 43% over half a decade, implying that the company is doing better recently. Someone with an optimistic perspective could view the recent improvement in TSR as indicating that the business itself is getting better with time. I find it very interesting to look at share price over the long term as a proxy for business performance. But to truly gain insight, we need to consider other information, too. Case in point: We've spotted 1 warning sign for Hammond Manufacturing you should be aware of.
Of course Hammond Manufacturing may not be the best stock to buy. So you may wish to see this free collection of growth stocks.
Please note, the market returns quoted in this article reflect the market weighted average returns of stocks that currently trade on Canadian exchanges.
Have feedback on this article? Concerned about the content? Get in touch with us directly. Alternatively, email editorial-team (at) simplywallst.com.
This article by Simply Wall St is general in nature. We provide commentary based on historical data and analyst forecasts only using an unbiased methodology and our articles are not intended to be financial advice. It does not constitute a recommendation to buy or sell any stock, and does not take account of your objectives, or your financial situation. We aim to bring you long-term focused analysis driven by fundamental data. Note that our analysis may not factor in the latest price-sensitive company announcements or qualitative material. Simply Wall St has no position in any stocks mentioned.
