
 Yahoo Finance
 Is Hafary Holdings Limited's (SGX:5VS) ROE Of 32% Impressive?
One of the best investments we can make is in our own knowledge and skill set. With that in mind, this article will work through how we can use Return On Equity (ROE) to better understand a business. By way of learning-by-doing, we'll look at ROE to gain a better understanding of Hafary Holdings Limited (SGX:5VS).
Return on Equity or ROE is a test of how effectively a company is growing its value and managing investors’ money. Simply put, it is used to assess the profitability of a company in relation to its equity capital.
Check out our latest analysis for Hafary Holdings
How Is ROE Calculated?
ROE can be calculated by using the formula:
Return on Equity = Net Profit (from continuing operations) ÷ Shareholders' Equity
So, based on the above formula, the ROE for Hafary Holdings is:
32% = S$40m ÷ S$126m (Based on the trailing twelve months to December 2023).
The 'return' refers to a company's earnings over the last year. So, this means that for every SGD1 of its shareholder's investments, the company generates a profit of SGD0.32.
Does Hafary Holdings Have A Good ROE?
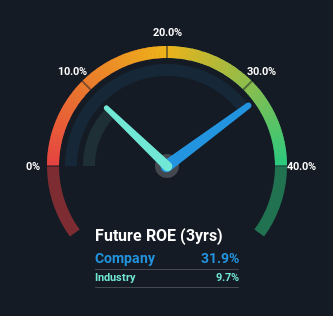
Arguably the easiest way to assess company's ROE is to compare it with the average in its industry. The limitation of this approach is that some companies are quite different from others, even within the same industry classification. As you can see in the graphic below, Hafary Holdings has a higher ROE than the average (9.7%) in the Trade Distributors industry.
That's clearly a positive. However, bear in mind that a high ROE doesn’t necessarily indicate efficient profit generation. Especially when a firm uses high levels of debt to finance its debt which may boost its ROE but the high leverage puts the company at risk. To know the 2 risks we have identified for Hafary Holdings visit our risks dashboard for free.
Why You Should Consider Debt When Looking At ROE
Most companies need money -- from somewhere -- to grow their profits. That cash can come from retained earnings, issuing new shares (equity), or debt. In the first and second cases, the ROE will reflect this use of cash for investment in the business. In the latter case, the debt required for growth will boost returns, but will not impact the shareholders' equity. Thus the use of debt can improve ROE, albeit along with extra risk in the case of stormy weather, metaphorically speaking.
Hafary Holdings' Debt And Its 32% ROE
It's worth noting the high use of debt by Hafary Holdings, leading to its debt to equity ratio of 2.02. Its ROE is pretty impressive but, it would have probably been lower without the use of debt. Debt increases risk and reduces options for the company in the future, so you generally want to see some good returns from using it.
Conclusion
Return on equity is one way we can compare its business quality of different companies. Companies that can achieve high returns on equity without too much debt are generally of good quality. If two companies have around the same level of debt to equity, and one has a higher ROE, I'd generally prefer the one with higher ROE.
But ROE is just one piece of a bigger puzzle, since high quality businesses often trade on high multiples of earnings. Profit growth rates, versus the expectations reflected in the price of the stock, are a particularly important to consider. Check the past profit growth by Hafary Holdings by looking at this visualization of past earnings, revenue and cash flow.
If you would prefer check out another company -- one with potentially superior financials -- then do not miss this free list of interesting companies, that have HIGH return on equity and low debt.
Have feedback on this article? Concerned about the content? Get in touch with us directly. Alternatively, email editorial-team (at) simplywallst.com.
This article by Simply Wall St is general in nature. We provide commentary based on historical data and analyst forecasts only using an unbiased methodology and our articles are not intended to be financial advice. It does not constitute a recommendation to buy or sell any stock, and does not take account of your objectives, or your financial situation. We aim to bring you long-term focused analysis driven by fundamental data. Note that our analysis may not factor in the latest price-sensitive company announcements or qualitative material. Simply Wall St has no position in any stocks mentioned.
