
 Yahoo Finance
 If You Had Bought Stingray Group (TSE:RAY.A) Shares A Year Ago You'd Have Earned 55% Returns
Passive investing in index funds can generate returns that roughly match the overall market. But one can do better than that by picking better than average stocks (as part of a diversified portfolio). To wit, the Stingray Group Inc. (TSE:RAY.A) share price is 55% higher than it was a year ago, much better than the market return of around 34% (not including dividends) in the same period. If it can keep that out-performance up over the long term, investors will do very well! However, the longer term returns haven't been so impressive, with the stock up just 2.0% in the last three years.
View our latest analysis for Stingray Group
While the efficient markets hypothesis continues to be taught by some, it has been proven that markets are over-reactive dynamic systems, and investors are not always rational. By comparing earnings per share (EPS) and share price changes over time, we can get a feel for how investor attitudes to a company have morphed over time.
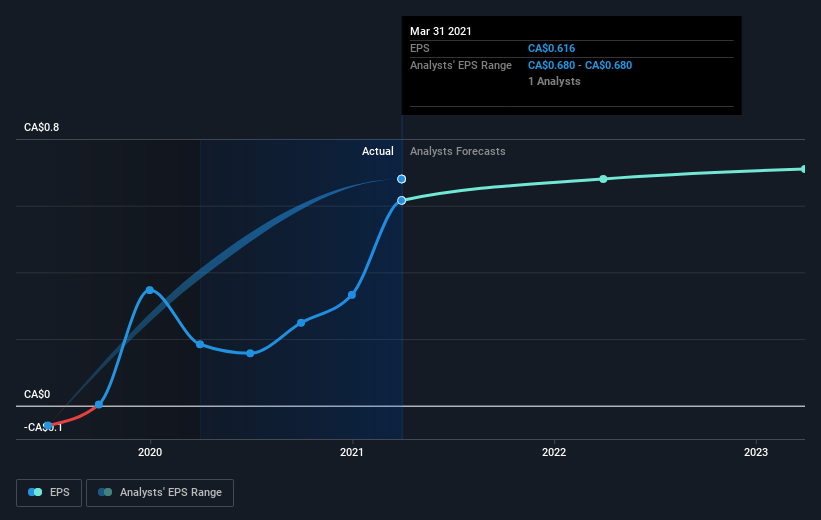
During the last year Stingray Group grew its earnings per share (EPS) by 234%. This EPS growth is significantly higher than the 55% increase in the share price. So it seems like the market has cooled on Stingray Group, despite the growth. Interesting.
The image below shows how EPS has tracked over time (if you click on the image you can see greater detail).
It's good to see that there was some significant insider buying in the last three months. That's a positive. That said, we think earnings and revenue growth trends are even more important factors to consider. Dive deeper into the earnings by checking this interactive graph of Stingray Group's earnings, revenue and cash flow.
What About Dividends?
As well as measuring the share price return, investors should also consider the total shareholder return (TSR). Whereas the share price return only reflects the change in the share price, the TSR includes the value of dividends (assuming they were reinvested) and the benefit of any discounted capital raising or spin-off. It's fair to say that the TSR gives a more complete picture for stocks that pay a dividend. We note that for Stingray Group the TSR over the last year was 60%, which is better than the share price return mentioned above. And there's no prize for guessing that the dividend payments largely explain the divergence!
A Different Perspective
It's nice to see that Stingray Group shareholders have received a total shareholder return of 60% over the last year. That's including the dividend. That's better than the annualised return of 7% over half a decade, implying that the company is doing better recently. In the best case scenario, this may hint at some real business momentum, implying that now could be a great time to delve deeper. While it is well worth considering the different impacts that market conditions can have on the share price, there are other factors that are even more important. Even so, be aware that Stingray Group is showing 2 warning signs in our investment analysis , you should know about...
Stingray Group is not the only stock insiders are buying. So take a peek at this free list of growing companies with insider buying.
Please note, the market returns quoted in this article reflect the market weighted average returns of stocks that currently trade on CA exchanges.
This article by Simply Wall St is general in nature. It does not constitute a recommendation to buy or sell any stock, and does not take account of your objectives, or your financial situation. We aim to bring you long-term focused analysis driven by fundamental data. Note that our analysis may not factor in the latest price-sensitive company announcements or qualitative material. Simply Wall St has no position in any stocks mentioned.
Have feedback on this article? Concerned about the content? Get in touch with us directly. Alternatively, email editorial-team (at) simplywallst.com.
